Figures & data
Figure 1 Application of the ophthalmodynamometer on the infratemporal eyelid during an SD-OCT examination.
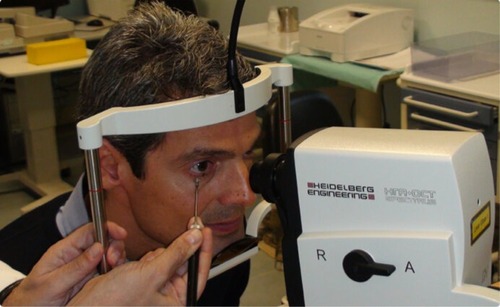
Figure 2 Vertical distances from the line connecting the Bruch’s membrane ends to the anterior surface of the lamina cribrosa and the prelaminar tissue at baseline (A and C) and during IOP elevation (B and D) in an eye with mild glaucoma.
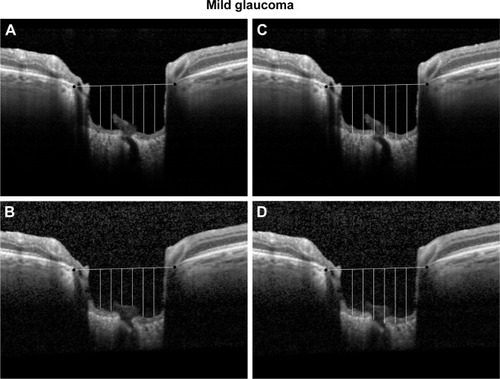
Figure 3 Vertical distances from the line connecting the Bruch’s membrane ends to the anterior surface of the lamina cribrosa and the prelaminar tissue at baseline (A and C) and during IOP elevation (B and D) in an eye with severe glaucoma.
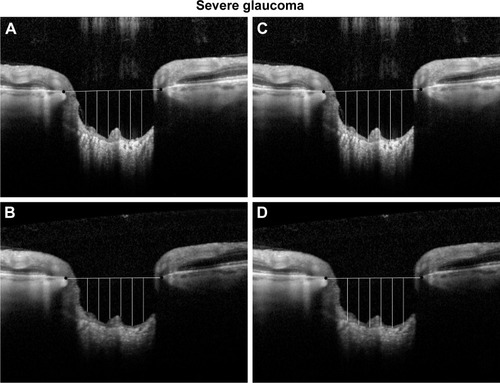
Figure 4 Vertical distances from the line connecting the Bruch’s membrane ends to the anterior surface of the lamina cribrosa and the prelaminar tissue at baseline (A and C) and during IOP elevation (B and D) in a control eye.
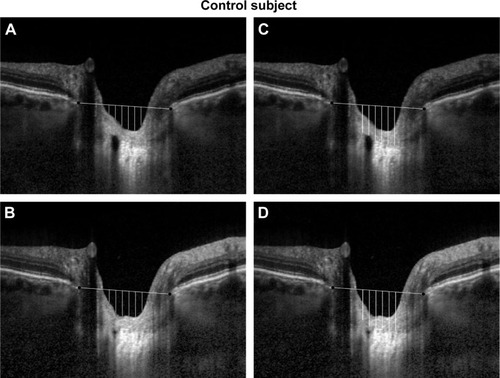
Table 1 Demographic data of the participants to the study
Table 2 Values at baseline and comparison among groups
Table 3 Baseline IOP with GAT, Tonopen, and ORA
Table 4 IOP during ophthalmodynamometer application and forces applied
Table 5 Values during IOP elevation and comparison among groups
Table 6 Intragroup comparison between values at baseline and during IOP increase
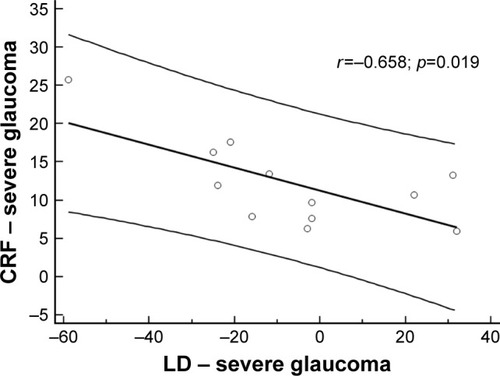
Figure 5 Scatterplot illustrating the inverse correlation by Spearman’s test between CRF and LD in eyes with severe glaucoma.