Figures & data
Table 1 Patient background and history
Figure 1 Mean IOP.
Notes: The IOP for the study eyes was determined at the pre-Retisert, pre-Ahmed valve, and 1-week, 1-, 3-, and 6-month and 1-, 2-, and 3-year follow-up time points. Results for each group are represented as mean ± SEM. #Indicates values that are significantly different from all other time points, as assessed by one-way ANOVA with Tukey–Kramer post hoc test (p<0.05).
Abbreviations: AGV, Ahmed glaucoma valve; ANOVA, analysis of variance; IOP, intraocular pressure.
Abbreviations: AGV, Ahmed glaucoma valve; ANOVA, analysis of variance; IOP, intraocular pressure.
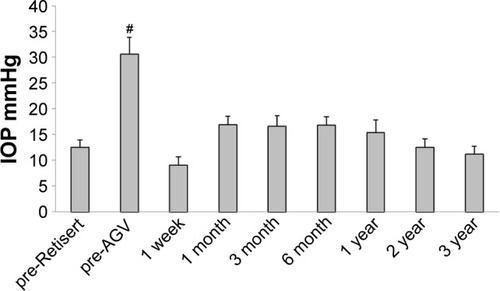
Figure 2 Mean number of IOP-lowering medications.
Notes: The mean number of IOP-lowering drops used for the study eyes was determined at the pre-AGV, 1-week, 1-, 3-, and 6-month, and 1-, 2-, and 3-year follow-up time points. Results for each group are represented as mean ± SEM. Differences between means were assessed by one-way ANOVA with Tukey–Kramer post hoc test (p<0.05). #Indicates significant difference from pre-AGV, 3-month, 6-month, and 2-year time points. *Indicates significant difference from 1 year group. ¥Indicates significant difference from pre-AGV time point.
Abbreviations: AGV, Ahmed glaucoma valve; ANOVA, analysis of variance; IOP, intraocular pressure; SEM, standard error of the mean.
Abbreviations: AGV, Ahmed glaucoma valve; ANOVA, analysis of variance; IOP, intraocular pressure; SEM, standard error of the mean.
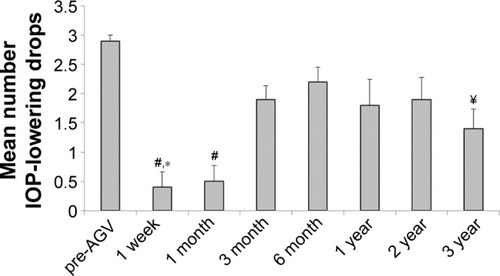
Figure 3 rNFL thickness.
Notes: The rNFL thickness for the study eyes as determined by OCT was assessed at the pre-Ahmed valve and 1-, 2-, and 3-year follow-up time points. Results for each group are represented as mean ± SEM. Significance was determined by one-way ANOVA with Tukey–Kramer post hoc test (p<0.05).
Abbreviations: AGV, Ahmed glaucoma valve; ANOVA, analysis of variance; rNFL, retinal nerve fiber layer; OCT, optical coherence tomography; SEM, standard error of the mean.
Abbreviations: AGV, Ahmed glaucoma valve; ANOVA, analysis of variance; rNFL, retinal nerve fiber layer; OCT, optical coherence tomography; SEM, standard error of the mean.
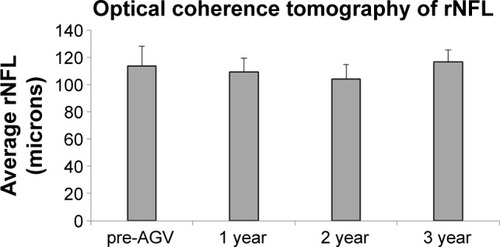
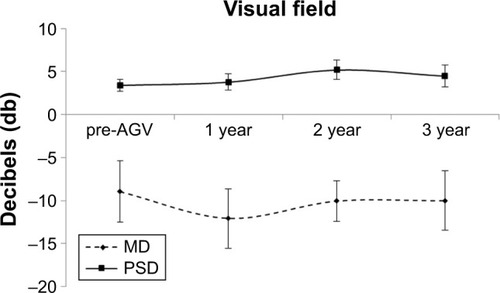
Figure 4 Humphrey Visual Field.
Notes: Analysis of the visual field was made by observation of the MD and PSD. These were assessed at the pre-Ahmed valve, and 1-, 2-, and 3-year follow-up time points. Results for each group are represented as mean ± SEM. Significance was determined by one-way ANOVA with Tukey–Kramer post hoc test (p<0.05).
Abbreviations: AGV, Ahmed glaucoma valve; ANOVA, analysis of variance; MD, mean deviation; SEM, standard error of the mean; PSD, pattern standard deviation.
Abbreviations: AGV, Ahmed glaucoma valve; ANOVA, analysis of variance; MD, mean deviation; SEM, standard error of the mean; PSD, pattern standard deviation.