
Figures & data
Figure 1 Schematic (A) and photograph (B) of halo bench components and layout. The optical layout of the Optikos system is similar to the halo bench system.
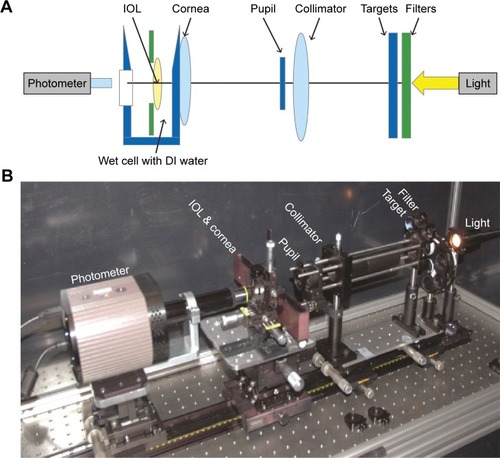
Figure 2 Cross-section of halo images from the 2 systems. (A) Eight-bit images with saturated centers using the Optikos bench system. (B) Full-range halo intensity using the HDR system.
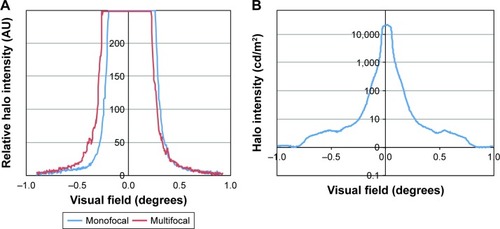
Figure 3 Optikos pinhole images: (A) IQ monofocal, (B) ReSTOR +2.5 D, (C) ReSTOR +3.0 D, and (D) ReSTOR +4.0 D.
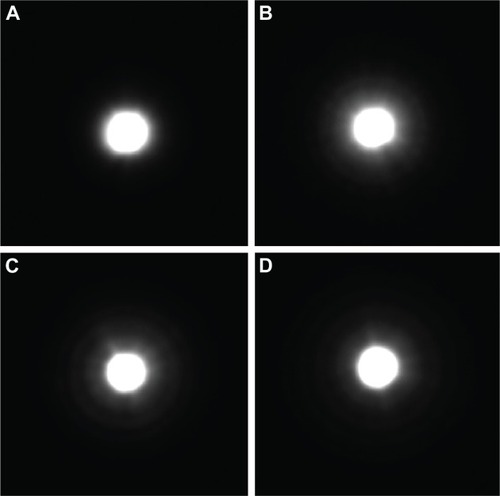
Figure 4 Halo luminance profiles showing the average of 8 radii of the halo image for each IOL in (A) Log and (B) LogNorm.
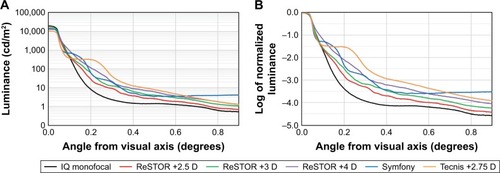
Figure 5 Two-dimensional 16-bit HDR halo data with logarithmic scaling for IOL models: (A) IQ monofocal, (B) ReSTOR +2.5 D, (C) ReSTOR +3.0 D, (D) ReSTOR +4.0 D, (E) Symfony, and (F) Tecnis +2.75 D. Luminance values below 2 cd/m2 were discarded to match with average road luminance at night.
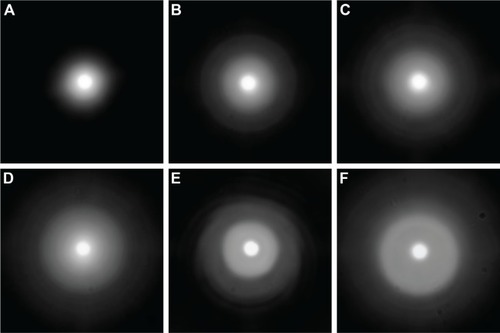
Table 1 Measured AUC values
Figure 6 Linear regression of bench measurement plotted against clinical halo severity. For each IOL type, 1 value of laboratory-measured AUC was plotted against the 4 levels of halo severity reported clinically for that IOL. Halo severity was subjectively rated by patients as none, mild, moderate, or severe, giving 4 regression lines. The legend symbols are circle for IQ monofocal, square for ReSTOR +2.5 D, triangle for ReSTOR +3.0 D, and diamond for ReSTOR +4.0 D. Values for ReSTOR +3.0 D “mild” and “moderate” overlapped and did not appear as separate points. r is the Pearson’s correlation coefficient.
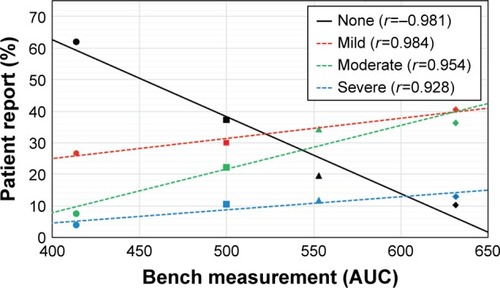
Table 2 Summary of subjective response of halo severity level