Figures & data
Figure 1 Schematic of tear film adhesion modeling.
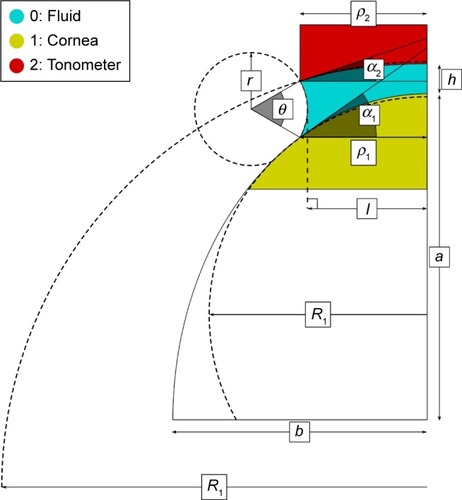
Figure 2 CATS tonometer prism cross section of the modified applanating surface.
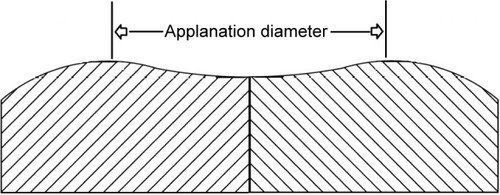
Figure 3 Photograph of the CATS tonometer prism and GAT prism applanating surfaces.
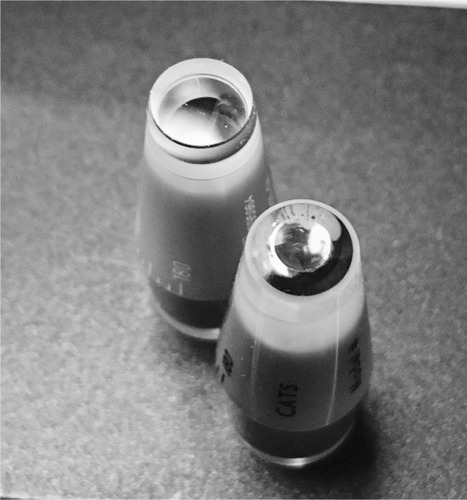
Figure 4 Illustration of Goldmann applanation tonometry tear film adhesion.
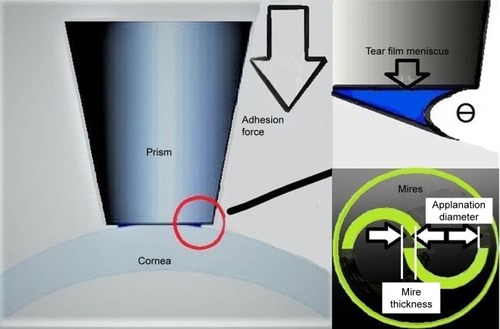
Figure 5 Photograph of applanation tonometry tear film adhesion measurement setup with Perkins tonometer, acrylic hemisphere, scale, and mire imaging microscope.
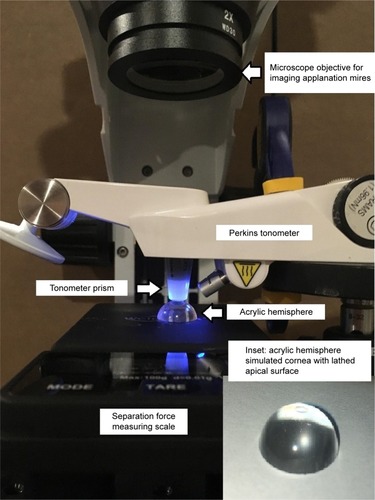
Figure 6 Photograph of applanation tonometry tear film adhesion measurement setup with Perkins tonometer and cadaver eye apparatus.
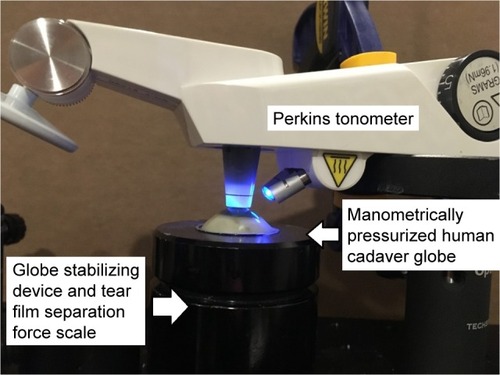
Figure 7 Tear film adhesion force error (mmHg) comparing the CATS and GAT prisms on PMMA-simulated cornea.
Abbreviations: CATS, correcting applanation tonometry surface; GAT, Goldmann applanation tonometer; PMMA, polymethyl methacrylate.
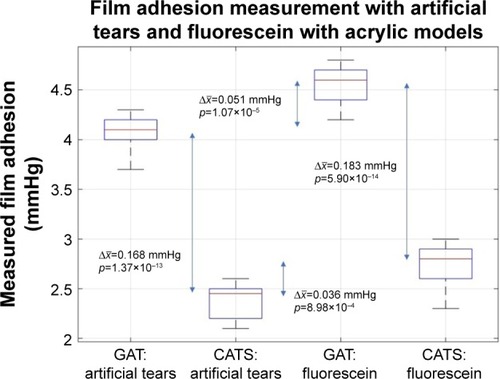
Figure 8 Cadaver globe tear film adhesion force error (mmHg) comparing the CATS (blue) and GAT (red) prisms demonstrating curvilinear fits from GLME analysis along with 95% confidence intervals.
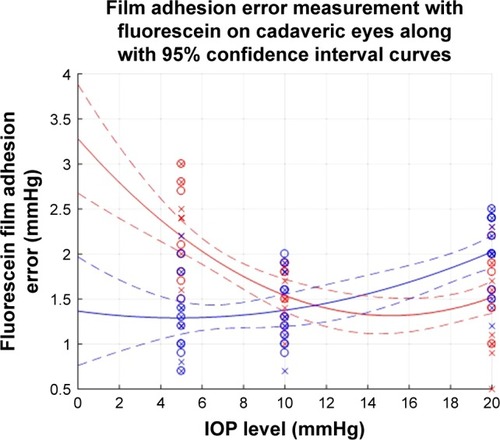
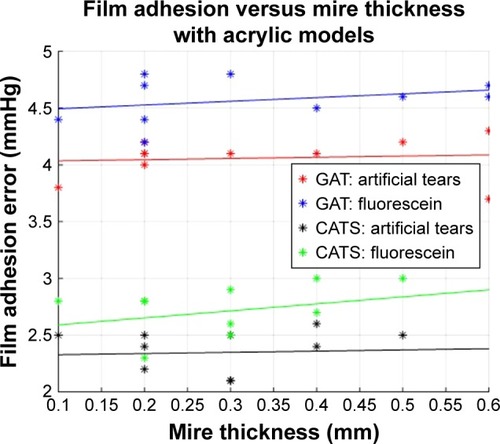
Figure 9 Tear film adhesion error versus applanation meniscus mire thickness in CATS and GAT prisms using GLME multivariate analysis output.