68
Views
5
CrossRef citations to date
0
Altmetric
Original Research

The 24-hour intraocular pressure control by tafluprost/timolol fixed combination after switching from the concomitant use of tafluprost and timolol gel-forming solution, in patients with primary open-angle glaucoma

, , , , , , , & show all
Pages 359-367 | Published online: 19 Feb 2018

Figures & data

Figure 1 Study outline. IOP was measured over a 24-hour period at weeks 8 and 16, starting at 21:00.

Abbreviations: IOP, intraocular pressure; TAF/TIM-FC, tafluprost/timolol fixed combination.
Figure 1 Study outline. IOP was measured over a 24-hour period at weeks 8 and 16, starting at 21:00.

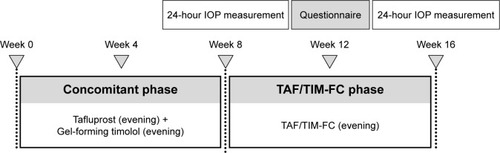
Table 1 Patients’ characteristics

Figure 2 IOP during the 24-hour measurement periods, measured in the sitting position with a Goldmann Applanation Tonometer.

Notes: The graphs show the mean IOP values (with SDs) for TAF/TIM-FC (triangles) and the concomitant use of the individual components (circles). (**P<0.01, *P<0.05, n=19, mixed-effect model).
Abbreviations: IOP, intraocular pressure; TAF/TIM-FC, tafluprost/timolol fixed combination.
Figure 2 IOP during the 24-hour measurement periods, measured in the sitting position with a Goldmann Applanation Tonometer.

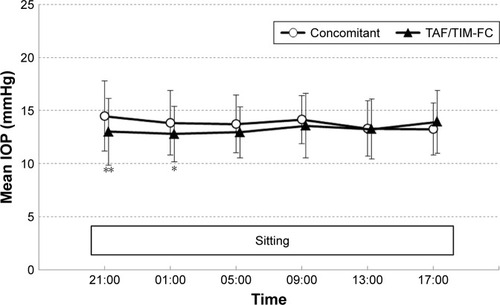
Table 2 Twenty-four-hour IOP profiles for the concomitant and TAF/TIM-FC treatments measured using a Goldmann Applanation Tonometer

Figure 3 IOP measured in the habitual positions during the 24-hour measurement periods.

Notes: IOP was measured with an Icare PRO tonometer in the sitting position at 21:00, 09:00, 13:00 and 17:00 and in the supine position at 01:00 and 05:00. The graphs show the mean IOP values (with SDs) for TAF/TIM-FC (triangles) and the concomitant use of the individual components (circles). (**P<0.01, n=19, mixed-effect model).
Abbreviations: IOP, intraocular pressure; TAF/TIM-FC, tafluprost/timolol fixed combination.
Figure 3 IOP measured in the habitual positions during the 24-hour measurement periods.

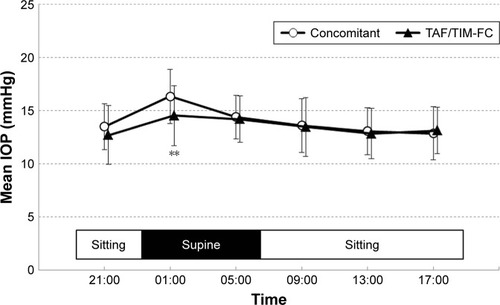
Table 3 Twenty-four-hour IOP profiles for the concomitant and TAF/TIM-FC treatments, measured in the sitting or supine position with an Icare PRO tonometer

Table 4 Mean blood pressure and heart rate during the 24-hour measurement

Figure 4 Responses to the questionnaire after switching treatment.

Notes: Pie charts of the subjects’ questionnaire survey answers for (A) the frequency of instillation forgetfulness; (B) user-friendliness and (C) continuation preference. The P-values were calculated using sign tests (n=20).
Figure 4 Responses to the questionnaire after switching treatment.

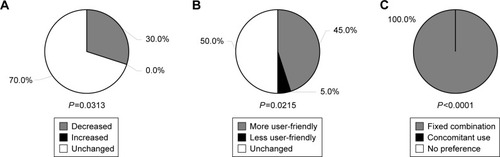
Table 5 Adverse events related to the study treatment