
Figures & data
Table 1 Subject characteristics
Figure 1 A scatter plot of SIA in each surgical group. The red and blue dots in each chart indicate the mean SIA vectors of the group and the SIA of each eye, respectively. The red circles indicate 95% confidence interval. All the astigmatic values are expressed in a plus-cylinder format. The astigmatism in the direction of 0° indicates against-the-rule astigmatism, and that in the direction of 90° indicates with-the-rule astigmatism. Each ring indicates 1.5 D.
Abbreviations: SIA, surgically induced astigmatism; LEC, trabeculectomy; EXP, EX-PRESS® shunt; exLOT, ab externo trabeculotomy; μLOT, microhook ab interno trabeculotomy.
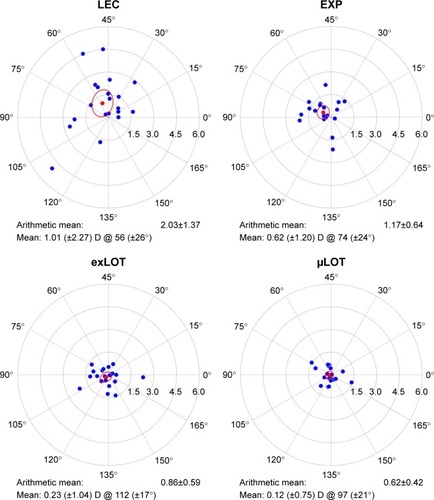
Table 2 Comparison of astigmatism parameters among the surgical groups
Table 3 Possible association between SIA magnitude, IOP, and BCVA at 3 months postoperatively (n=80)