Figures & data
Figure 1 Measurement of the hypotenuse of the vertical optic nerve head cup using the depth (A) and length (B) of the cup as the sides of a right-angled triangle whose hypotenuse is calculated by the Pythagorean theorem.
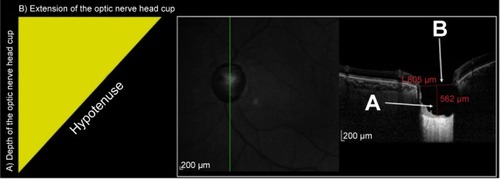
Table 1 Demographic characteristics of study participants
Figure 2 Box plot of average circumpapillary retinal nerve fiber layer (RNFL) thickness.
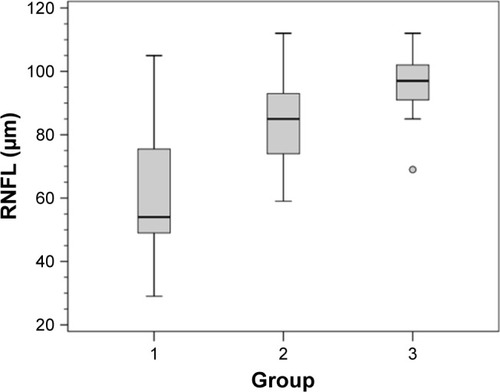
Table 2 Global average and median circumpapillary RNFLthickness measured by SD-OCT
Table 3 Mean extension and mean depth of the vertical optic nerve head cup and the hypotenuse between these values
Figure 3 Box plot of the mean hypotenuse of the vertical optic nerve head cup for glaucoma groups and controls in different vertical diameters of the optic disc.
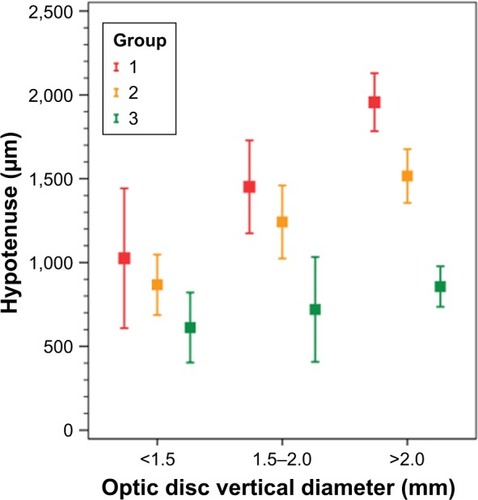
Table 4 Mean (SE) of the hypotenuse of the vertical optic disc in nerves with vertical diameter <1.5 mm and the significance between groups (n=20)Table Footnotea
Table 5 Mean (SE) of the hypotenuse of the vertical optic disc in nerves with vertical diameter between 1.50 and 2.00 mm and the significance between groups (n=120)Table Footnotea
Table 6 Mean (SE) of the hypotenuse of the vertical optic disc in nerves with vertical diameter >2.0 mm and the significance between groups (n=16)Table Footnotea
Figure 4 Scatter plot of the correlation between the mean deviation (MD) of standard automated perimetry and the hypotenuse of the vertical optic nerve head cup.
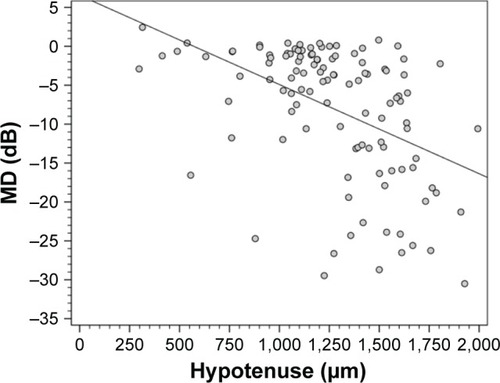
Figure 5 Scatter plot of the correlation between peripapillary retinal nerve fiber layer (RNFL) thickness measured by spectral-domain optical coherence tomography and the hypotenuse of the vertical optic nerve head cup.
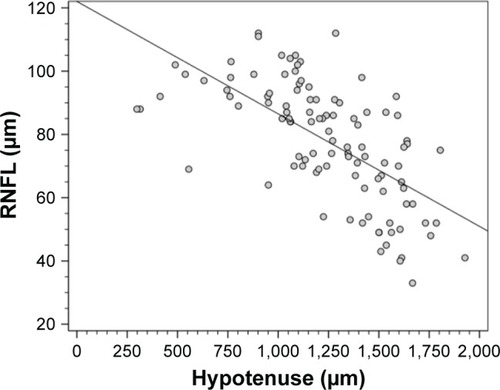
Figure 6 Box plot of the percentile groups of the hypotenuse of the vertical optic nerve head cup.
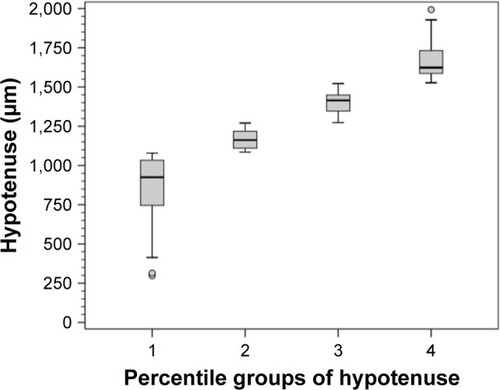
Figure 7 Box plot of the mean deviation (MD) of standard automated perimetry in each percentile group of the hypotenuse of the vertical optic nerve head cup.
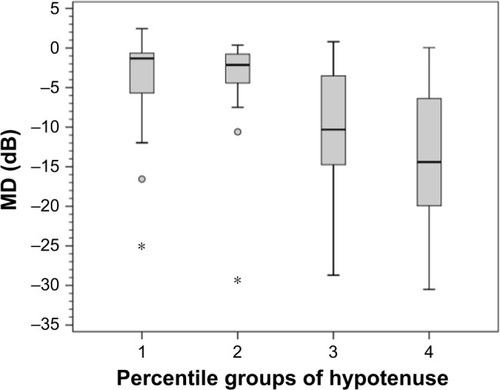
Figure 8 Box plot of circumpapillary retinal nerve fiber layer (RNFL) thickness measured by spectral-domain optical coherence tomography in each percentile group of the hypotenuse of the vertical optic nerve head cup.
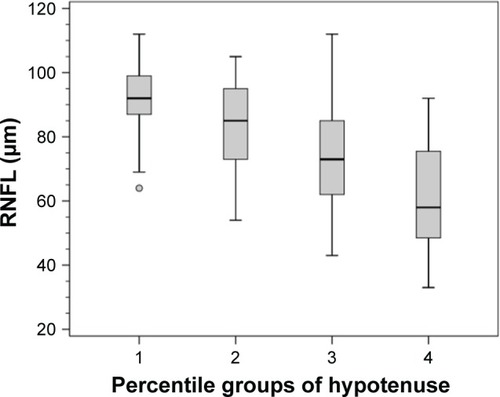
Table 7 Distribution of eyes with and without glaucoma among the four percentile groups of the HVOC
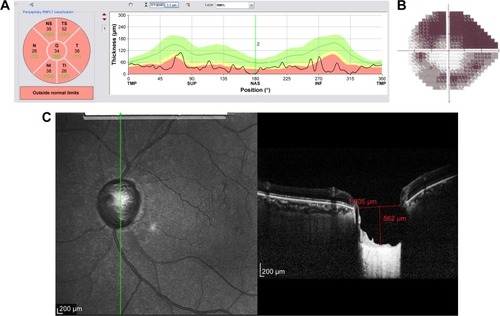
Figure 9 Structural and functional findings in a glaucomatous eye in percentile group 1 of the HVOC (mean =940 µm, mean MD =−4.70 (1.2) dB). (A) Circumpapillary RNFLT; (B) standard automated perimetry grayscale map; (C) B-scan of the largest vertical optic disc cup and length and depth used to calculate the HVOC.
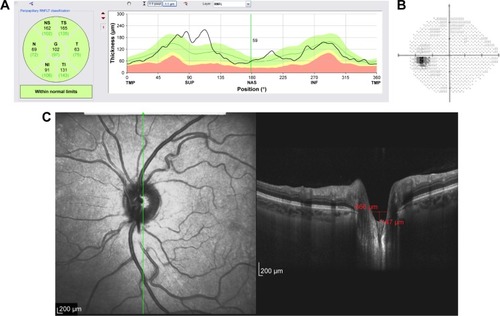
Figure 10 Structural and functional findings in a glaucomatous eye in percentile group 2 of the HVOC (mean =1,128 µm, mean MD =−5.10 (1.0) dB). (A) Circumpapillary RNFLT; (B) standard automated perimetry grayscale map; (C) B-scan of the largest vertical optic disc cup and length and depth used to calculate the HVOC.
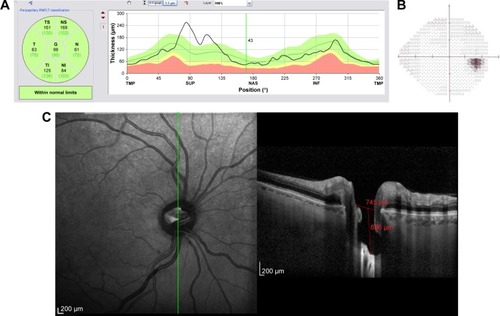
Figure 11 Structural and functional findings in a glaucomatous eye in percentile group 3 of the HVOC (mean =1,390 µm, mean MD =−10.40 (1.4) dB). (A) Circumpapillary RNFLT; (B) standard automated perimetry grayscale map; (C) B-scan of the largest vertical optic disc cup and length and depth used to calculate the HVOC.
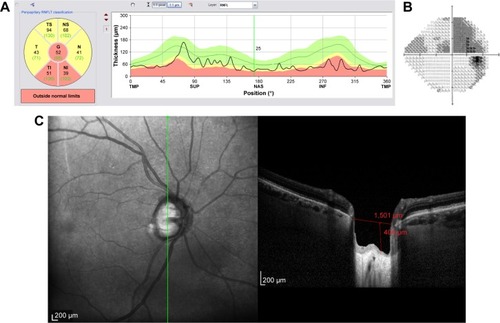
Figure 12 Structural and functional findings in a glaucomatous eye in percentile group 4 of the HVOC (mean =1,662 µm, mean MD =−12.90 (1.4) dB). (A) Circumpapillary RNFLT; (B) standard automated perimetry grayscale map; (C) B-scan of the largest vertical optic disc cup and length and depth used to calculate the HVOC.