
Figures & data
Figure 1 HYUIP technique 1.
Notes: (A) The irrigation port of the tip was used to push the left side of the corneal incision for 5–10 seconds. (B) The procedure listed in part A was repeated for the right side. (C) The procedure listed in part A was repeated in the up and down directions. (D) After pushing the three sides, the tip was immediately drawn back inside the anterior chamber.
Abbreviation: HYUIP, hydration using irrigation port.
Abbreviation: HYUIP, hydration using irrigation port.
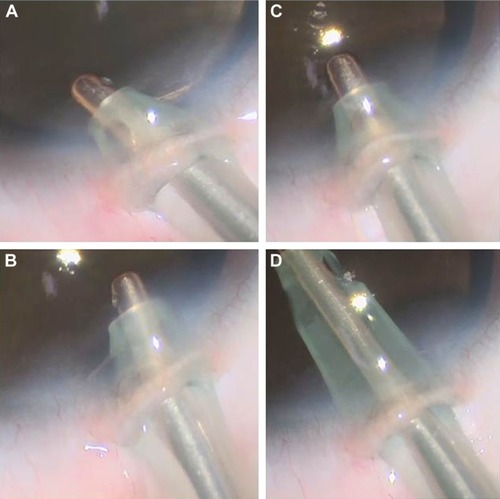
Figure 2 HYUIP technique 2.
Notes: (A) The tip was maintained in place until the anterior chamber depth stabilized. (B) When the tip was removed, it was pulled from the anterior chamber using a single stroke. (C) MQA was used to confirm the presence of any leakage from the incisional wound. (D) After extracting the tip, the anterior chamber depth was maintained without any further changes.
Abbreviations: HYUIP, hydration using irrigation port; MQA, Medical Quick Absorber.
Abbreviations: HYUIP, hydration using irrigation port; MQA, Medical Quick Absorber.
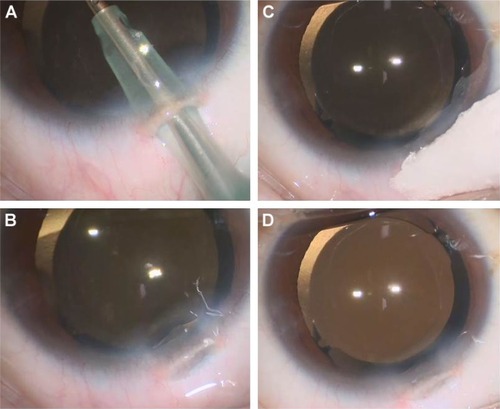
Figure 3 OCT images of the HYUIP technique group.
Notes: Red arrows indicate the corneal incisional wound. Red triangles indicate corneal stromal edema. Images show that the incision layer was self-sealing due to the presence of edema at both the left and right edges.
Abbreviations: HYUIP, hydration using irrigation port; OCT, optical coherence tomography.
Abbreviations: HYUIP, hydration using irrigation port; OCT, optical coherence tomography.
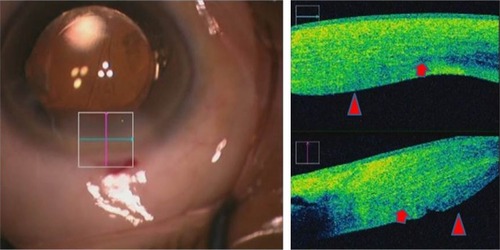
Figure 4 OCT images of normal hydration.
Notes: Red arrows indicate slight detachment of Descemet’s membrane. Red triangles indicate corneal stromal edema. Images show that the incision layer was self-sealed due to the presence of edema around all the incision.
Abbreviation: OCT, optical coherence tomography.
Abbreviation: OCT, optical coherence tomography.
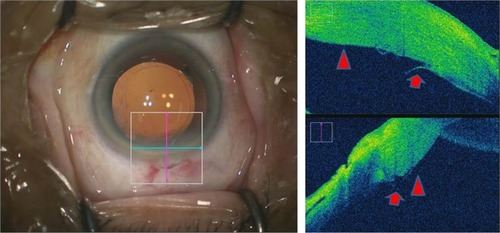
Figure 5 Degree of decrease (%) in cell density (mean ± SD).
Abbreviations: HYUIP, hydration using irrigation port; NS, not significant; SD, standard deviation.
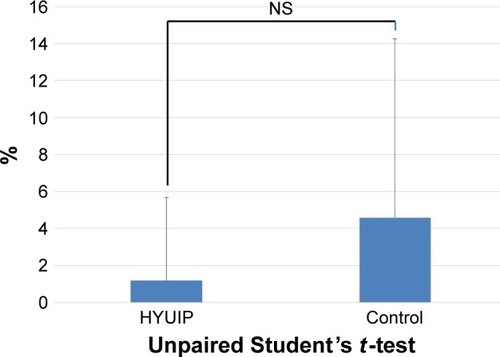
Table 1 Comparison between the two groups