
Figures & data
Table 1 Number of each group according to the size
Table 2 Clinical characteristics of all patients
Figure 1 Infant, 6 months of age, with right-eye hemangioma.
Notes: Upper lid hemangioma (A) before treatment and (B) at 3 months post-treatment.
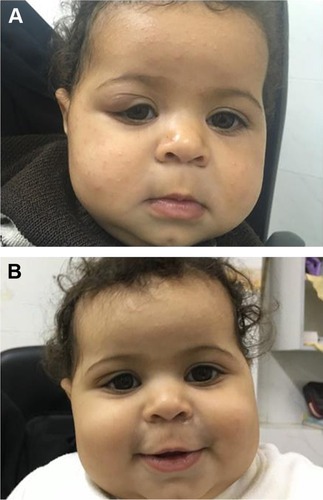
Figure 2 Infant, 2 months of age, with left-eye hemangioma.
Notes: Lower lid hemangioma (A) before treatment and (B) at 2 months post-treatment.
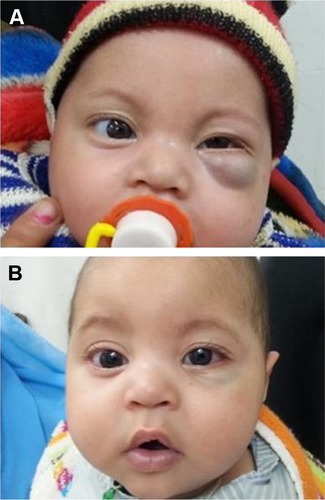
Figure 3 Infant, 3 months of age, with left-eye hemangioma.
Notes: Upper lid hemangioma (A) before treatment and (B) at 4 months post-treatment.
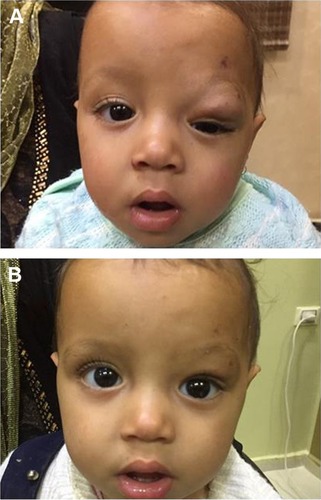
Table 3 Number of tumors according to regression