Figures & data
Figure 1 An abbreviated CONSORT flow diagram indicating the complete subject disposition throughout the trial.
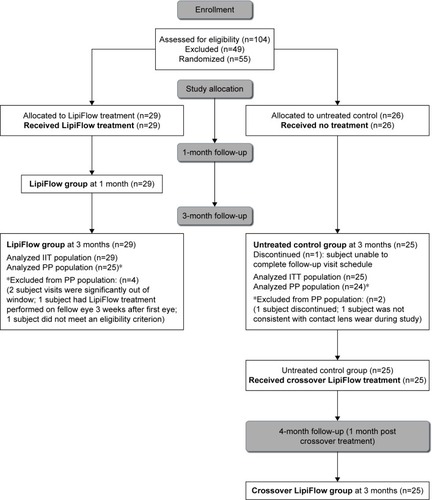
Table 1 Demographics for treatment (VTP) and untreated control groups: ITT population
Table 2 Summary of primary and secondary endpoints: ITT population
Table 3 Summary of statistically significant additional exploratory analyses
Figure 2 The mean change in comfortable contact lens wear time from baseline to 3 months post-single VTP treatment.
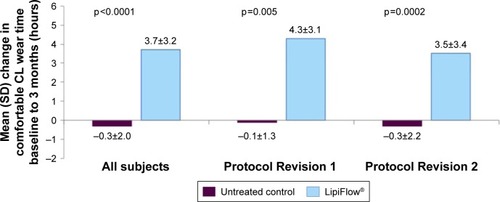
Table 4 Summary of contact lens wear analyses by protocol revision: ITT population
Figure 3 DMI images from four different study subjects.
Abbreviation: DMI, Dynamic Meibomian Imaging.
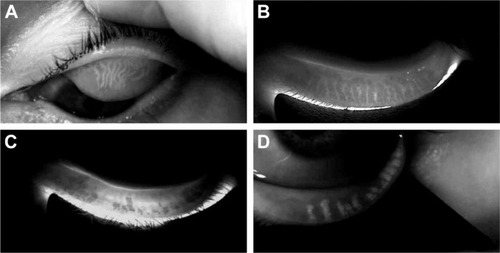
Figure 4 The mean change in OTC drop use frequency from baseline to 3 months post-single VTP treatment.
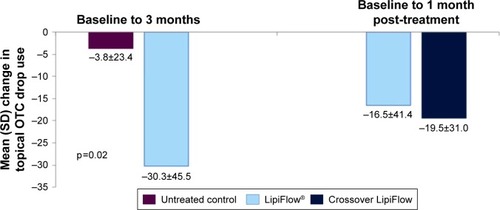
Figure 5 The mean change in OSDI total and component scores from baseline to 3 months post-single VTP treatment.
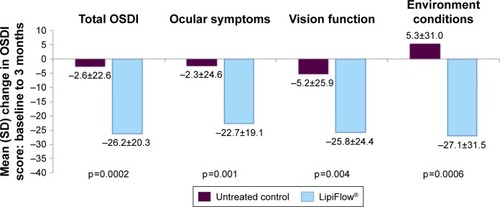
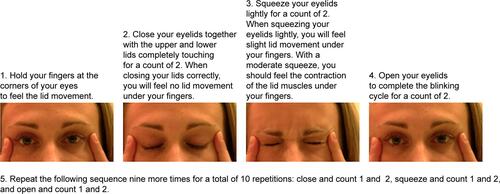
Figure S1 Blinking exercises.
Note: Perform 10 repetitions every hour for a minimum of 10 times per day every day.