
Figures & data
Figure 1 Fitting of the corneal specimen on the BioTester device rake battery just prior to testing.
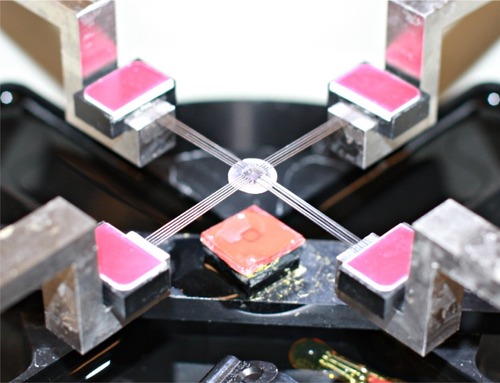
Figure 2 Young’s modulus E linear regression fitting performed on stress–strain curves.
Notes: Data illustrate stress (shear force ÷ cross-section, expressed in kPa) versus relative displacement (strain, reported as %). From left to right, top to bottom, Group A (SMILE-3D), Group B (SMILE-8D), Group C (LASIK-3D), and Group D (LASIK-8D). Young’s modulus corresponds to the slope, which is indicated by the numeric factor preceding variable x in each trend-line function per group, expressed in kPa and converted to MPa in the data listed in .
Abbreviation: SMILE, small-incision lenticule extraction.
Abbreviation: SMILE, small-incision lenticule extraction.
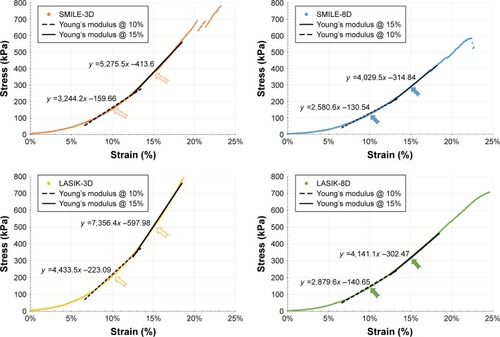
Table 1 Comparative tensile measurements between the six groups
Figure 3 Summary of biomechanical tensile test differential results per group studied.
Note: Young’s modulus (units MPa) and stress results (units kPa) calculated at 10% and 15% strain.
Abbreviation: SMILE, small-incision lenticule extraction.
Abbreviation: SMILE, small-incision lenticule extraction.
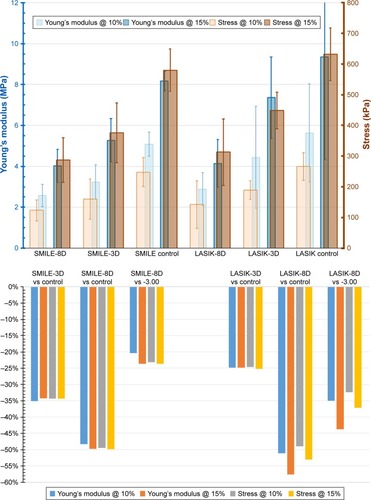
Table 2 Comparative analysis of tensile results