Figures & data
Figure 1 Box plot of accommodative amplitude versus iris color showing the medians and 25% and 75% quartiles.
Abbreviations: AA, accommodative amplitude; IC, iris color.
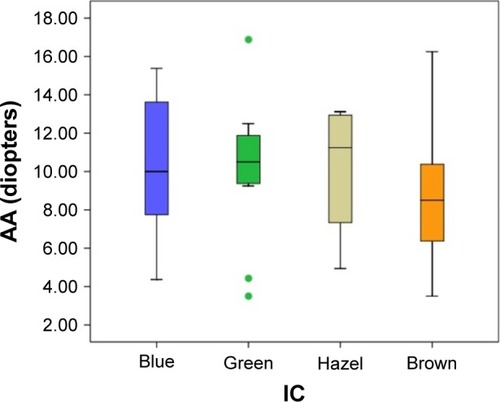
Table 1 Age, IC, pre- and postpilocarpine mean keratometry, SER, refractive cylinder, pupil size, and accommodative amplitude
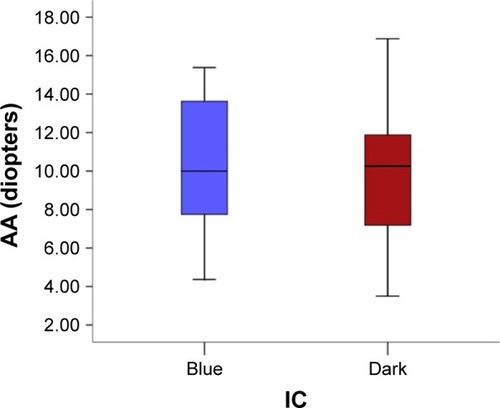
Figure 2 Box plot of accommodative amplitude versus blue and dark iris color showing the medians and 25% and 75% quartiles.
Abbreviations: AA, accommodative amplitude; IC, iris color.