
Figures & data
Figure 1 Box plot showing distribution of TNF-α level in PEG cases and control group.
Abbreviations: TNF-α, tumor necrosis factor alpha; PEG, pseudoexfoliation glaucoma.
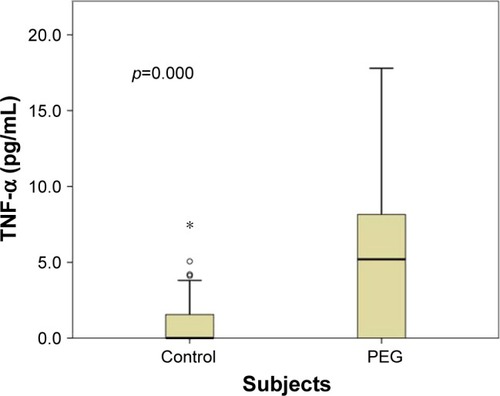
Table 1 Distribution of demographic, clinical characteristics and TNF-α concentration in PEG cases and controls
Table 2 Dose effect of TNF-α level and the risk of PEG
Table 3 Correlation between TNF-α level and other clinical variables
Table 4 Regression analysis to determine the effect of age, sex and TNF-α levels on PEG