Figures & data
Figure 1 Measurement areas for macula Early Treatment Diabetic Retinopathy Study grid (A), macula 6 circle (B), and circumpapillary RNFL circle (C) overlaid with example projected images. Single-frame OCT B-scan images overlaid with boundaries (green and blue lines) demonstrated the retinal layers in various retinal thickness measurements, including full retinal thickness (D); ganglion cell + inner plexiform layers (distance between the 2 green boundaries), ganglion cell complex (distance between the blue and green boundaries, vitreal to inner nuclear layer) (E); and retinal neural fiber layer (F). All the images were set with right eye orientation.
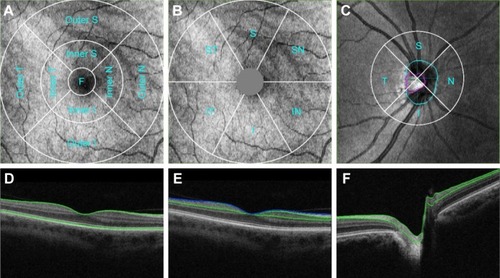
Figure 2 Quantile regression fits of various macula measurements from 12×9 wide and 6×6 macula scans are shown.
Abbreviations: FRT, full retinal thickness; GCC, ganglion cell complex; GCL, ganglion cell; IPL, inner plexiform layer.
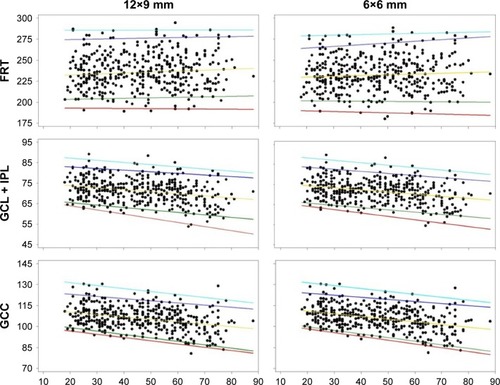
Table 1 Summary of selected scan parameters
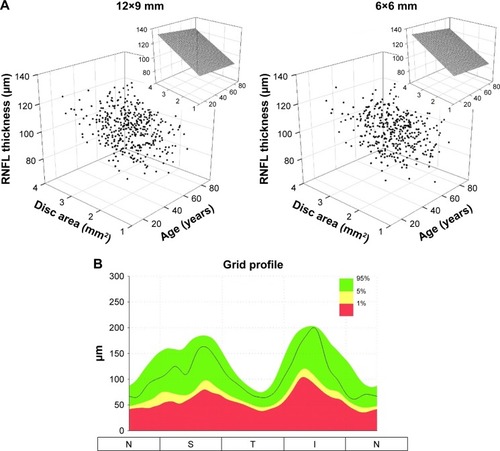
Figure 3 The relationships of cpRNFL thickness with age and disc area displayed in the 3D scatter plots (A). The insets show the effect of age and disc area on cpRNFL thickness based on median fits (50th percentile). The cpRNFL circle profile reference limits are shown (B).
Abbreviation: cpRNFL, circumpapillary retinal nerve fiber layer.