
Figures & data
Figure 1 Assessment of optical coherence tomography images of patients with age-related macular degeneration treated with intravitreal aflibercept.
Abbreviations: ELM, external limiting membrane; EZ, ellipsoid zone.
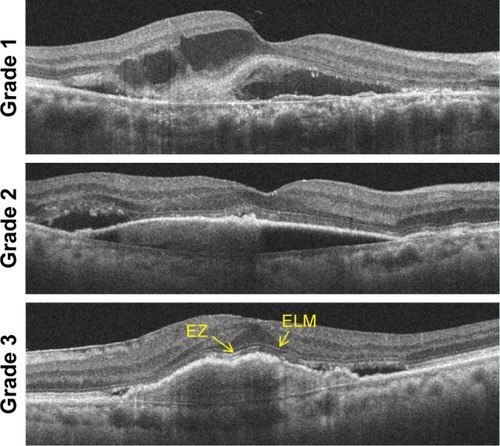
Figure 2 Results of assessments of functional and morphologic parameters of eyes with neovascular age-related macular degeneration treated with IVA injections over a 12-month period.
Abbreviations: BCVA, best-corrected visual acuity; IVA, intravitreal aflibercept; logMAR, logarithm of minimal angle of resolution; MD, mean deviation.
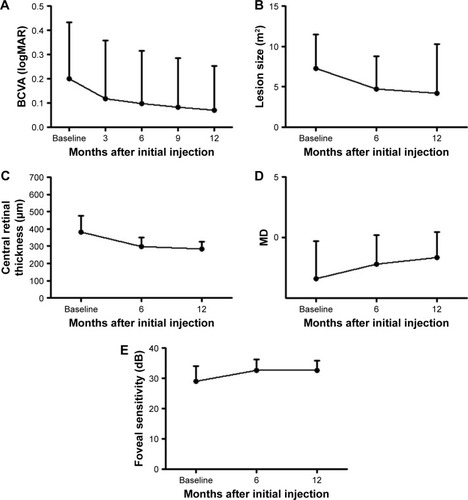
Table 1 Characteristics at baseline and 12 months after the aflibercept treatment in neovascular AMD patients
Figure 3 Scatterplots showing the relationship between change in lesion size over 12 months and change in MD for each treated eye.
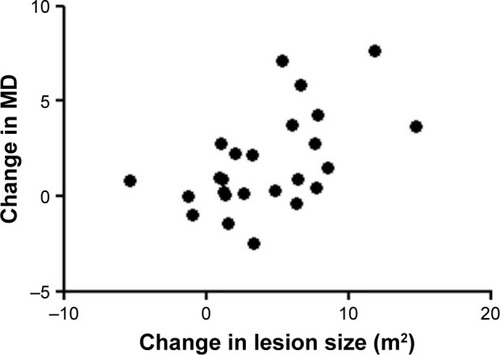
Figure 4 Grade of ELM and EZ of eyes with neovascular age-related macular degeneration treated with IVA injections over a 12-month period.
Abbreviations: ELM, external limiting membrane; EZ, ellipsoid zone; IVA, intravitreal aflibercept.
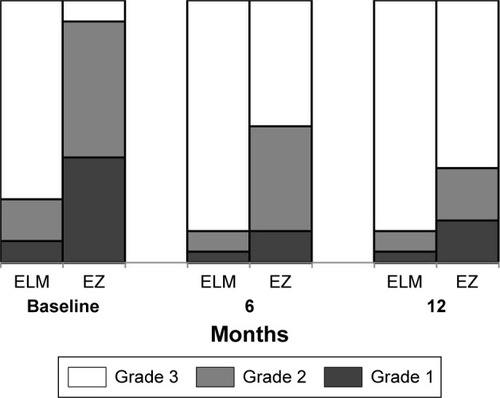
Figure 5 (A) Scatterplots showing the relationship between final best-corrected visual acuity (logMAR units) and baseline foveal threshold (dB) for each treated eye. (B) Scatterplots showing the relationship between final best-corrected visual acuity (logMAR units) and baseline integrity of the ELM for each treated eye.
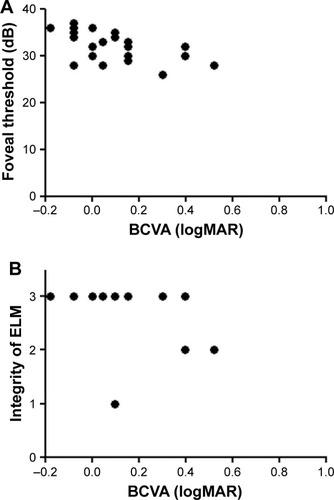
Table 2 Correlation between final best-corrected visual acuity in logMAR units and parameters