Figures & data
Figure 1 Effects of DHA/ω-3 fatty acids and lutein/zeaxanthin on pathways leading to DR.
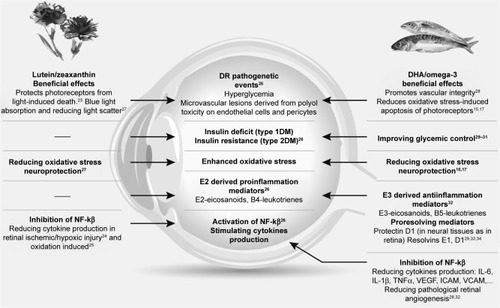
Table 1 Composition of Brudyretina 1.5 g (Brudy Lab S.L.), per capsule
Table 2 Demographics and clinical characteristics of the study population
Figure 2 Changes of macular sensitivity (A) and macular integrity index (B) in the 2 study groups at 90 days as compared with baseline (n=24 eyes in each study group).
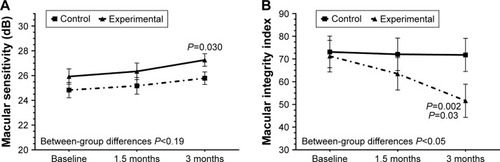
Table 3 Changes of macular function variables, visual acuity, CSMT, biochemical markers, and vision-related quality of life from baseline to 90 days after treatment with DHA supplementation as compared with controls
Figure 3 Changes of BCVA (ETDRs letters) (A) and CSMT (B) in the 2 study groups at 90 days as compared with baseline.
Abbreviations: OCT, optical coherence tomography; BCVA, best-corrected visual acuity; ETDRS, Early Treatment Diabetic Retinopathy Study; CSMT, central subfield macular thickness.
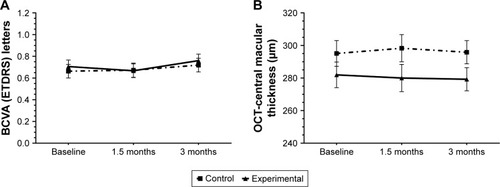
Figure 4 Changes of plasma TAC (A) and plasma levels of IL-6 (B) the study groups at 90 days as compared with baseline (n=12 patients in each study group).
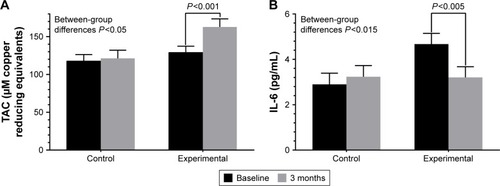
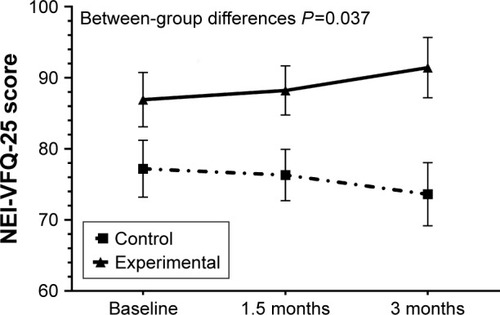
Figure 5 Changes in vision-related quality of life in the 2 study groups at 45 and 90 days as compared with baseline, with a clear trend toward improvement in the DHA supplementation group and toward worsening in the control group.
Abbreviations: NEI-VFQ-25, National Eye Institute Visual Function Questionnaire, near activities subscale score; DHA, docosahexaenoic acid.