
Figures & data
Figure 1 Patient flow diagram.
Abbreviations: IOP, intraocular pressure; MD, mean deviation.
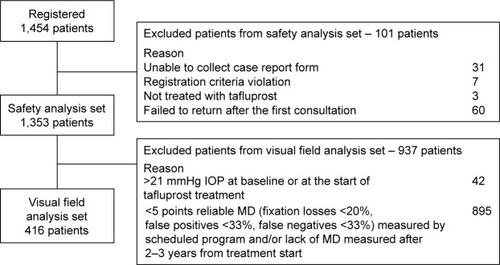
Table 1 Patient demographics
Table 2 MD slopes in differential analysis with treatment patterns in visual field analysis set
Figure 2 Patients continuing tafluprost treatment in 1,353 patients over the observational period of 2–3 years by Kaplan–Meier curve.
Notes: A discontinuation of tafluprost treatment due to insufficient efficacy and safety reason is defined as an event.
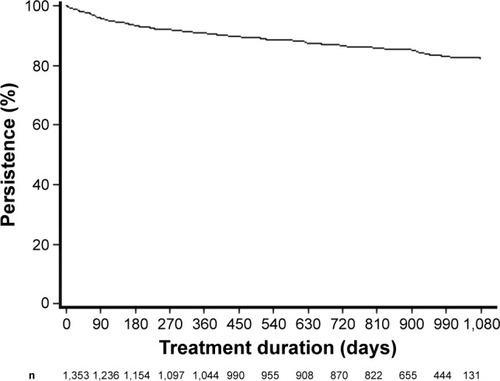
Figure 3 IOP in each analysis group.
Notes: IOP changes in all patients and each treatment pattern. IOPs were aggregated every 3 months from 0 to 36 months. Error bars indicate SD. *P<0.05 compared to IOP month 0 (paired t-test) in all treatment patterns.
Abbreviations: IOP, intraocular pressure; VF, visual field.
Abbreviations: IOP, intraocular pressure; VF, visual field.
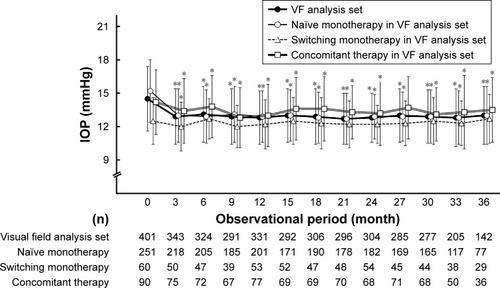
Table 3 MD slopes in differential analyses in visual field analysis set
Table 4 MD slopes in naïve monotherapy patients of the visual field analysis set
Table 5 MD slopes in differential analysis with % IOP reduction in naïve-monotherapy patients of the visual field analysis set