Figures & data
Table 1 Inclusion and exclusion criteria
Table 2 Demographics and characteristics of patients at baseline (N=40)
Figure 1 Mean log contrast sensitivity at baseline and week 20.
Notes: *Indicates the mean value. Difference between mean log contrast sensitivity at week 20 and at baseline was statistically significant: P<0.001.
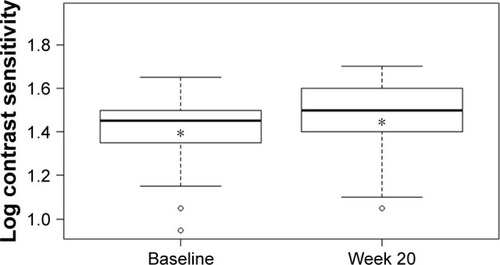
Figure 2 Mean logMAR best-corrected visual acuity at baseline and week 20. Notes: *Indicates the mean value. Difference between mean logMAR BCVA at week 20 and at baseline was statistically significant: P=0.0016.
Abbreviations: BCVA, best-corrected visual acuity; logMAR, logarithm of minimum angle of resolution.
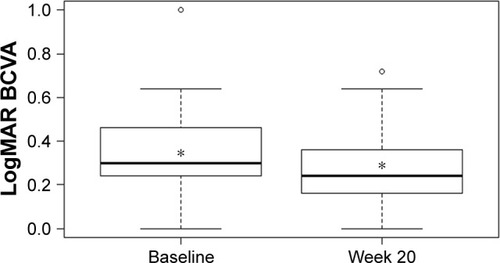
Figure 3 Mean central retinal thickness at baseline and week 20.
Notes: *Indicates the mean value. Difference between mean CRT at week 20 and at baseline was statistically significant: P<0.001.
Abbreviation: CRT, central retinal thickness.
Abbreviation: CRT, central retinal thickness.
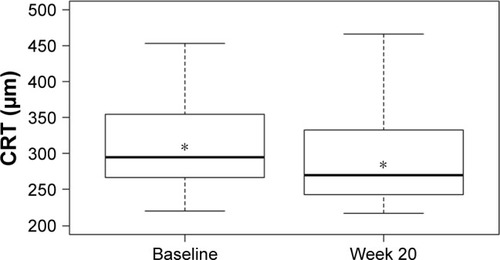
Figure 4 Change in log contrast sensitivity versus change in central retinal thickness at week 20.
Note: Relationship between change in CS and change in CRT was statistically significant: P<0.001.
Abbreviations: CRT, central retinal thickness; CS, contrast sensitivity.
Abbreviations: CRT, central retinal thickness; CS, contrast sensitivity.
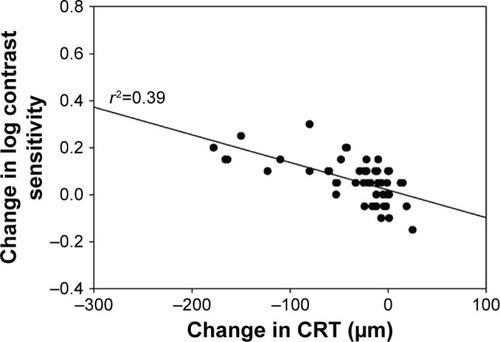
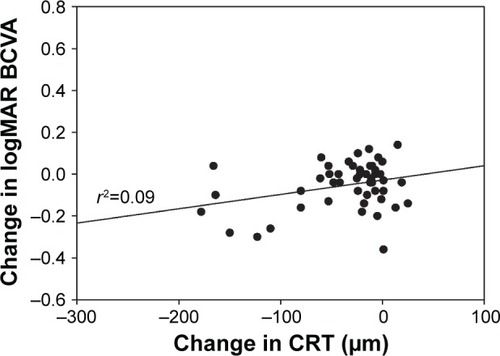
Figure 5 Change in logMAR best-corrected visual acuity versus change in central retinal thickness at week 20.
Note: Relationship between change in BCVA and change in CRT was statistically significant: P=0.032.
Abbreviations: BCVA, best-corrected visual acuity; CRT, central retinal thickness; logMAR, logarithm of minimum angle of resolution.
Abbreviations: BCVA, best-corrected visual acuity; CRT, central retinal thickness; logMAR, logarithm of minimum angle of resolution.