Figures & data
Table 1 VEGF levels in aqueous measured fresh and after storage at −80°C for 21 days
Figure 1 Comparative analysis of vascular endothelial growth factor (VEGF) concentration between fresh and frozen samples.
Note: Mean values are represented by solid red circles.
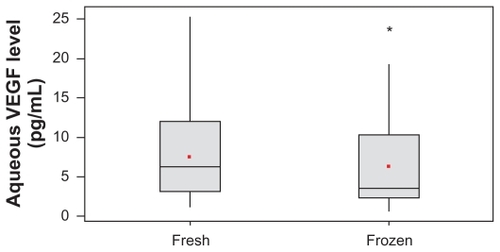
Table 2 Vascular endothelial growth factor (VEGF) levels in aqueous samples measured fresh and after storage at −80°C for 21 days based on clinical diagnosis