Figures & data
Figure 1 Pre- and postoperative OCTA image showing the FAZ and four polygonal areas surrounding the fovea.
Abbreviations: OCTA, optical coherence tomography angiography; FAZ, foveal avascular zone.
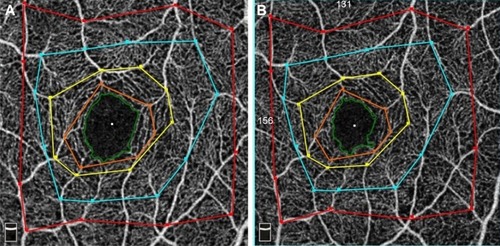
Table 1 Demographics of the patients and their characteristics before and after the surgery
Figure 2 Sequential changes in the FAZ area during the follow-up period (n=6).
Abbreviation: FAZ, foveal avascular zone.
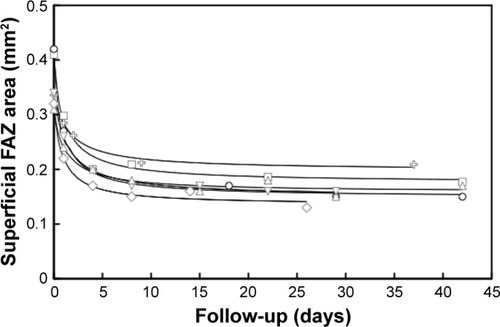
Table 2 A hyperbolic curve from the course of the postoperative decrease of the FAZ area
Figure 3 Association between pre- and postoperative FAZ areas and polygonal areas in the ILM-peeled eyes (n=7).
Abbreviations: FAZ, foveal avascular zone; ILM, internal limiting membrane.
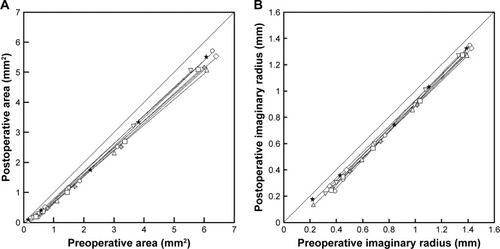
Table 3 A linear regression line from the pre- and postoperative five areas
Table 4 A regression line from the pre- and postoperative five imaginary radii
Table 5 Association between pre- and postoperative distance from the foveal center
Figure 4 Corresponding positions of bifurcations of the capillaries from pre- and postoperative 6×6 mm OCTA en face images including fovea and disc in Case 6.
Abbreviation: OCTA, optical coherence tomography angiography.
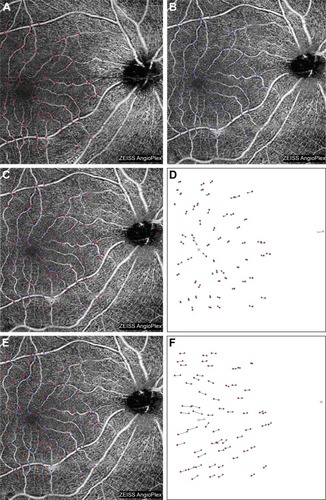
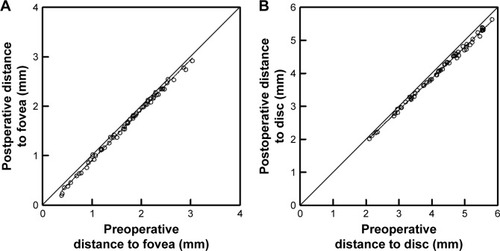
Figure 5 The association between pre- and postoperative distance from the foveal center or the disc center in Case 6.