
Figures & data
Table 1 Characteristics of the BRVO before intravitreal ranibizumab administration
Table 2 Correlation between VEGF and flare, CRT, and BCVA prior to intravitreal ranibizumab administration
Figure 1 A correlation between VEGF concentration and flare preoperatively, as shown by the single regression line (y=30.3x−59.1).
Abbreviation: VEGF, vascular endothelial growth factor.
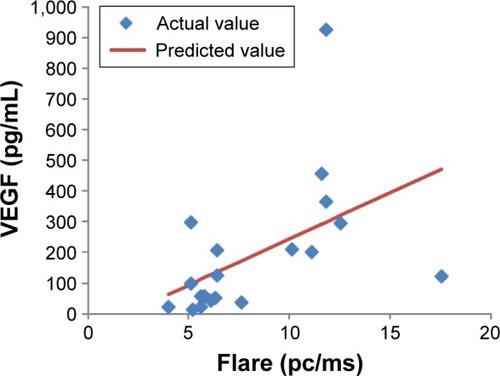
Figure 2 Time course of BCVA changes after IVR.
Note: The improvement was significant for all time points after IVR, as compared with before IVR.
Abbreviations: BCVA, best-corrected visual acuity; IVR, intravitreal ranibizumab.
Abbreviations: BCVA, best-corrected visual acuity; IVR, intravitreal ranibizumab.
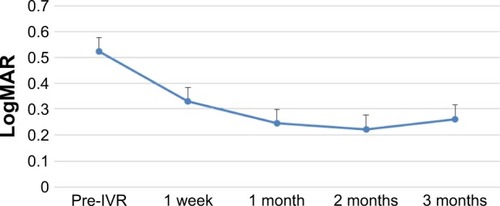
Figure 3 Time course of flare changes after IVR treatment.
Note: The improvement was significant for all time points after IVR, as compared with before IVR.
Abbreviation: IVR, intravitreal ranibizumab.
Abbreviation: IVR, intravitreal ranibizumab.
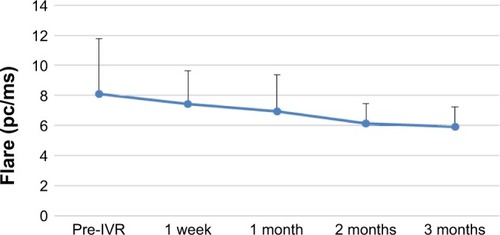
Figure 4 Time course of changes in CRT at the fovea after IVR treatment.
Note: The improvement was significant for all time points after IVR, as compared with before IVR.
Abbreviations: CRT, central retinal thickness; IVR, intravitreal ranibizumab.
Abbreviations: CRT, central retinal thickness; IVR, intravitreal ranibizumab.
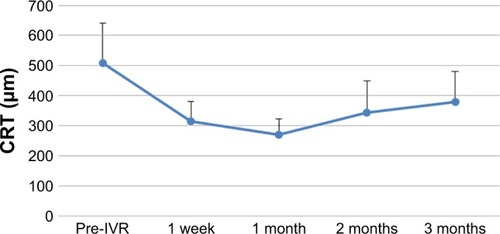
Table 3 The changes in VEGF, CRT, and flare values at the additional IVR
Table 4 Correlation between VEGF and CRT or flare at the time of additional IVR treatment