Figures & data
Table 1 Demographic and baseline disease data
Figure 1 Type of preservative used and corresponding OSDI scores before treatment switch to preservative-free AT.
Abbreviations: AT, artificial tear; BAK, benzalkonium chloride; OSDI, Ocular Surface Disease Index; Oxyd, Stabilized Chlorite Complex; Purtite, Stabilized Oxychloro Complex.
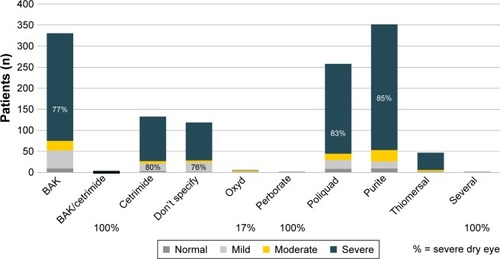
Figure 2 Percentage of patients with SPK at baseline according to preservatives.
Abbreviations: BAK, benzalkonium chloride; N/E, not evaluable; SPK, superficial punctate keratitis.
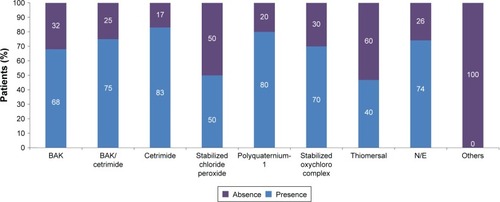
Figure 3 Mean OSDI score at baseline and follow-up visit.
Note: The decrease was statistically significant (P≤0.001).
Abbreviation: OSDI, Ocular Surface Disease Index.
Abbreviation: OSDI, Ocular Surface Disease Index.
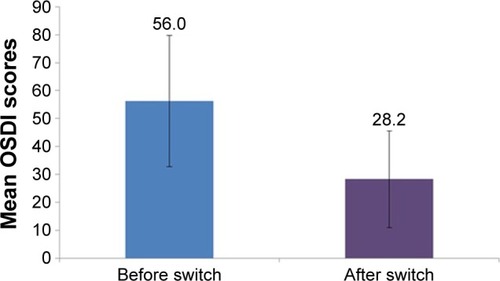
Figure 4 Percentage distribution of OSDI severity in patients before and after treatment switch.
Abbreviation: OSDI, Ocular Surface Disease Index.
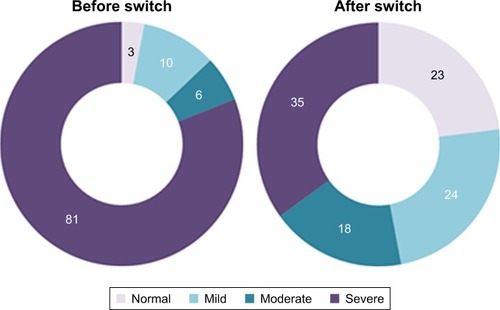
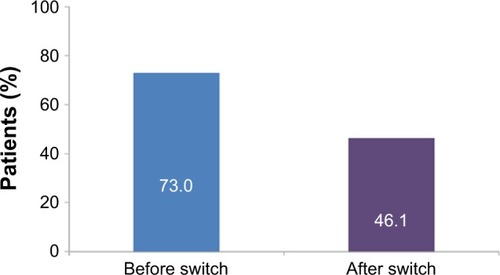
Figure 5 Percentage of patients with SPK after fluorescein staining before and after the treatment switch.
Note: The decrease was statistically significant (P≤0.001).
Abbreviation: SPK, superficial punctate keratitis.
Abbreviation: SPK, superficial punctate keratitis.