Figures & data
Figure 1 Color fundoscopic images of right a) and left b) eyes 72 hours postingestion demonstrating retinal pallor and cherry red spots. Fluorescein angiograms of right c) and left d) eyes 72 hours postingestion revealing normal retinal vessels.
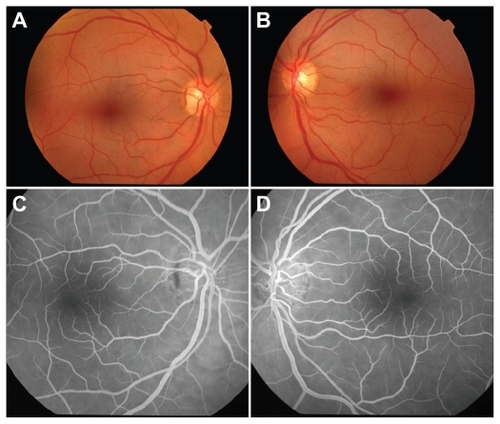
Figure 2 OCT images of the macula of the right a) and left b) eyes 72 hours postingestion demonstrating marked thickening and hyper-reflectivity of the inner retina.
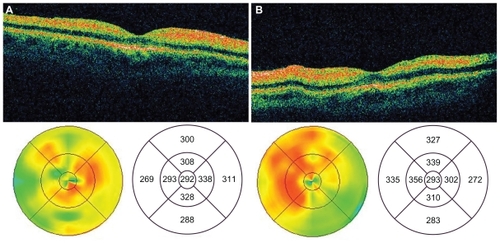
Figure 3 Color fundoscopic images of right a) and left b) eyes 28 months postingestion showing attenuated retinal vessels and optic nerve pallor. FA of the right c) and left d) eyes reveals attenuated vessels without evidence of perfusion deficits.
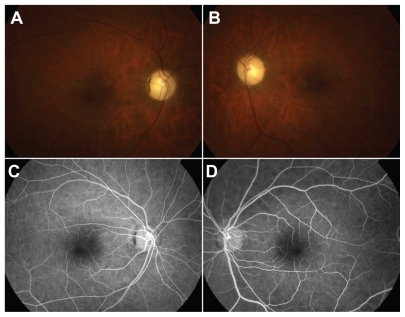
Figure 4 Time domain OCT images of the macula of the right a) and left b) eyes 28 months postingestion showing atrophy of the neuroretina.
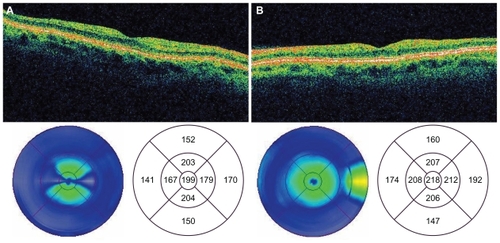
Figure 5 Spectral OCT images of the right a) and left b) eyes 28 months postingestion showing atrophy of the neuroretina.
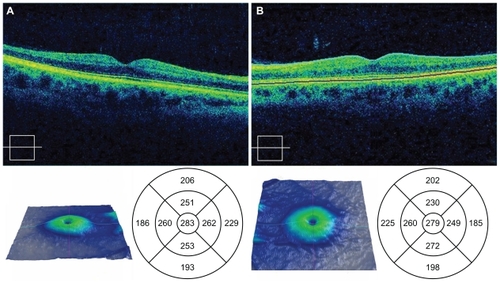
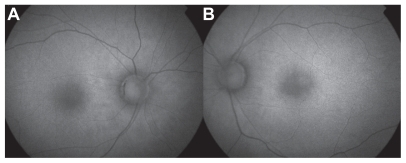
Figure 6 Fundus autofluorescence of right a) and left b) eyes 28 months postingestion demonstrating diffuse hyperfluorescence without evidence of RPE atrophic lesions OU.