Figures & data
Figure 1 Photograph of the iLid devices.
Note: The iLid devices are affixed to the external surface of each eyelid along the eyelid margin to target the terminal ducts of the meibomian glands with controlled delivery of thermal energy to the eyelids (41°C–45°C).
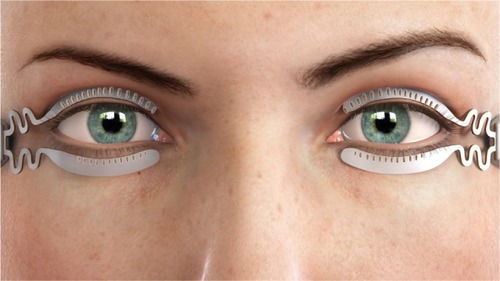
Figure 2 The TearCare® System controller unit.
Note: The clinician initiates therapy by pressing the On/off button. Once therapy is initiated, the controller monitors and regulates the delivery of thermal energy to the eyelids during the 12-minute procedure.
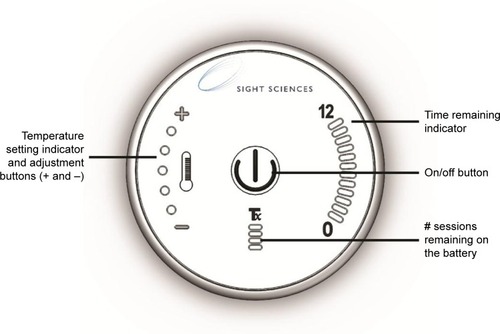
Table 1 Baseline demographics of the study population
Table 2 Baseline characteristics of the 2 study groups
Figure 3 Primary efficacy end point – TBUT results.
Notes: The mean (±SD) values for the TBUT measured in seconds are shown for the TearCare treatment group (solid circles) and the warm compress group (open squares). Significant improvements in the comparison between groups of the change from baseline (increases in the score from baseline) in TBUT were observed at each post-baseline visit for the TearCare group. *p<0.001.
Abbreviation: TBUT, tear breakup time.
Abbreviation: TBUT, tear breakup time.
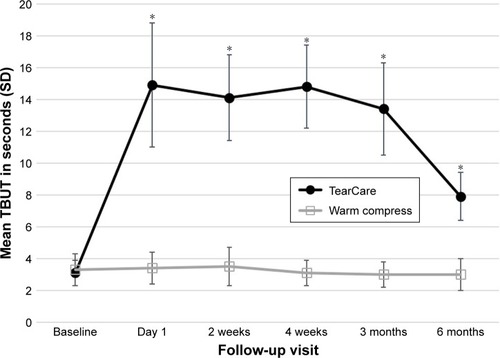
Table 3 Mean total corneal staining scores by treatment group and visit
Table 4 Mean conjunctival staining scores by treatment group and visit
Figure 4 Secondary efficacy end points – questionnaire results.
Notes: The mean (±SD) values for the subject responses to questionnaires evaluating the symptoms of dry eye are presented for the SPEED (A), the OSDI (B), and the SANDE questionnaires (C). Results are shown for the TearCare treatment group (solid circles) and the warm compress group (open squares). On comparison between the groups, significant improvements with change of mean scores from baseline (decreases in the score from baseline) are noted with the p-values for each panel.
Abbreviations: OSDI, ocular surface disease index; SANDE, symptom assessment in dry eye; SPEED, Standard Patient Evaluation for Eye Dryness.
Abbreviations: OSDI, ocular surface disease index; SANDE, symptom assessment in dry eye; SPEED, Standard Patient Evaluation for Eye Dryness.
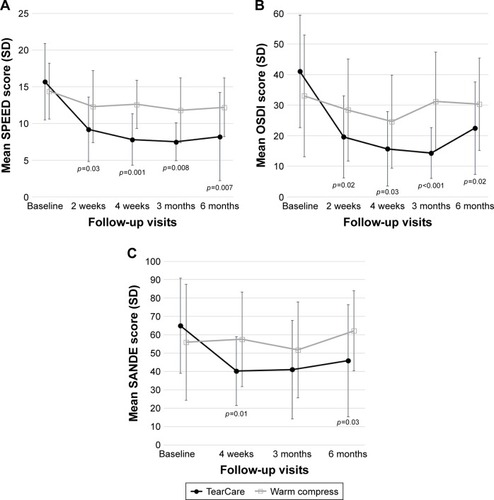
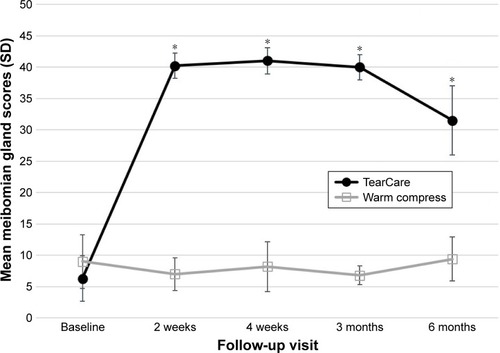
Figure 5 Secondary efficacy end point – meibomian gland score results.
Notes: The mean (±SD) values for the meibomian gland assessment scores are shown for the TearCare treatment group (solid circles) and the warm compress group (open squares). On comparison between the groups, significant improvements from baseline (increasing score from baseline) in meibomian gland scores were observed at each post-baseline visit for the TearCare group. *p<0.001.