
Figures & data
Table 1 Pre-op refractive measures
Figure 1 Linear regression of the change in simulated K vs the change in SE induced by WFG LASIK (A) and by WFO LASIK (B).
Abbreviations: K, keratometry; LASIK, laser-assisted in situ keratomileusis; SE, spherical equivalent; WFG, wavefront-guided; WFO, wavefront-optimized; Wlight, wavelight.
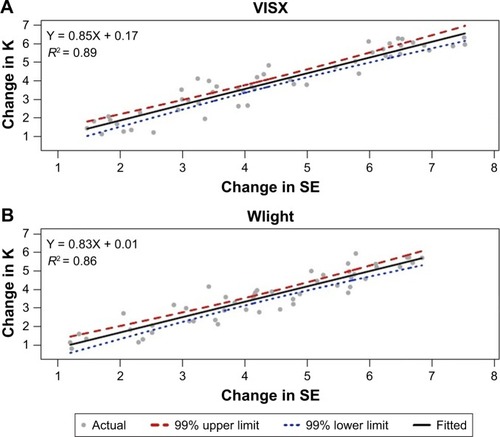
Table 2 Estimation results for the model (ΔK = α + β [ΔSE])
Figure 2 Ratio of change in simulated K to change in SE plotted by the amount of refractive correction for WFG LASIK (A) and WFO LASIK (B).
Abbreviations: K, keratometry; LASIK, laser-assisted in situ keratomileusis; SE, spherical equivalent; WFG, wavefront-guided; WFO, wavefront-optimized; Wlight, wavelight.
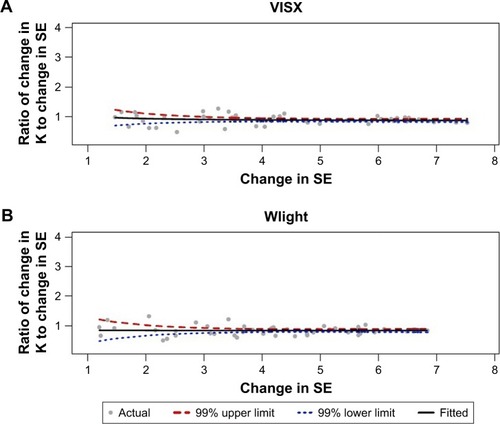
Table 3 Comparison of the ratio of change in K to change in SE by the amount of refractive correction
Table 4 Comparisons of the ratio of change in K to change in SE between WFG LASIK and WFO LASIK