
Figures & data
Table 1 Summary of studies reporting the AP corneal radius ratio
Table 2 Patient demographic information
Figure 1 Distribution of the AP corneal radius ratio in patients before cataract surgery.
Abbreviation: AP, anterior–posterior.
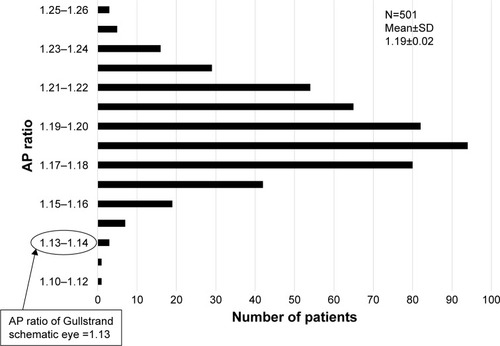
Figure 2 Correlation between the anterior–posterior corneal radius ratio (AP ratio) and the following parameters: corneal thickness (A; P<0.0001, rs =0.2233), anterior corneal radius (B; P=0.485), posterior corneal radius (C; P<0.0001, rs =−0.465), age (D; P=0.008, rs =−0.118), horizontal corneal diameter (E; P=0.0094, rs =−0.1161), axial length (F; P=0.2771), anterior chamber depth (G; P=0.6733), anterior corneal astigmatism (H; P=0.6294), posterior corneal astigmatism (I; P<0.0001, rs =0.2923), and total corneal astigmatism (J; P=0.7156).
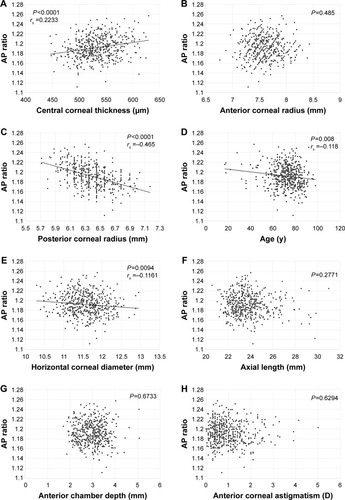
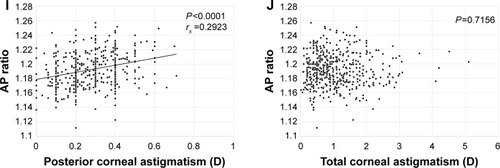
Figure 3 Correlation between the anterior–posterior corneal radius ratio and difference between the keratometric and total corneal refractive power.
Abbreviation: AP, anterior–posterior.
Table 3 Patient demographic information for sub-group analysis
Table 4 The results of IOL power calculation and the correlation between the PE and AP ratio in the 4 formulas
Figure 4 Correlation between the anterior–posterior corneal radius ratio and IOL power calculation error.
Abbreviations: AP, anterior–posterior; IOL, intraocular lens.
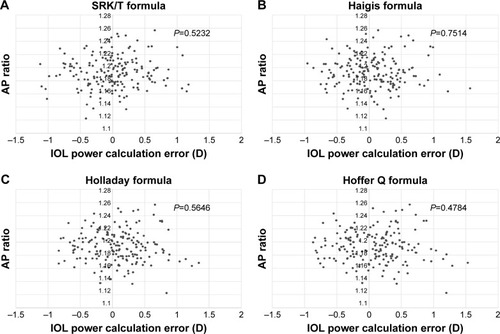
Table 5 Stepwise multiple regression analysis of factors influencing refractive prediction error after cataract surgery, performed with postoperative refractive prediction error as the dependent variable, and age, AP ratio, anterior/posterior corneal radius, horizontal corneal diameter, ACD, AL, and central corneal thickness as the independent variables