Figures & data
Table 1 Preoperative patient demographic information
Figure 1 Representative image of corneal topography and analysis points in SMILE and LASIK groups.
Notes: Corneal refractive power at each analysis diameter (0th–10th) was estimated using corneal refractive power on 25 mire rings (A). Initially, the “reference” area in both the SMILE and LASIK groups was defined as the position located at 0.5 mm from measurement center. Because the diameter of the optical zone between SMILE and LASIK groups is different (SMILE 6.5 mm, LASIK 6.0 mm), a diameter of optical zone was divided into 10 and each analysis point was named 1st–10th from the center to the periphery. The analysis diameter was rounded up to the first decimal place and is shown in (B).
Abbreviation: SMILE, small incision lenticule extraction.
Abbreviation: SMILE, small incision lenticule extraction.
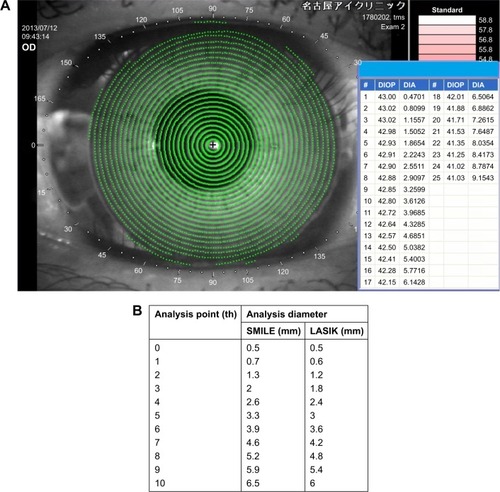
Figure 2 Visual outcomes in SMILE and LASIK groups.
Notes: There were no significant differences between the two groups regarding the ratio of UDVA 20/20 or better, or 20/13 or better (p=1.00) (A). Similarly, there were no significant differences between the two groups with regards to the ratio of CDVA 20/20 or better, or 20/13 or better (p=1.00) (B).
Abbreviations: CDVA, corrected distance visual acuity; SMILE, small incision lenticule extraction; UDVA, uncorrected distance visual acuity.
Abbreviations: CDVA, corrected distance visual acuity; SMILE, small incision lenticule extraction; UDVA, uncorrected distance visual acuity.
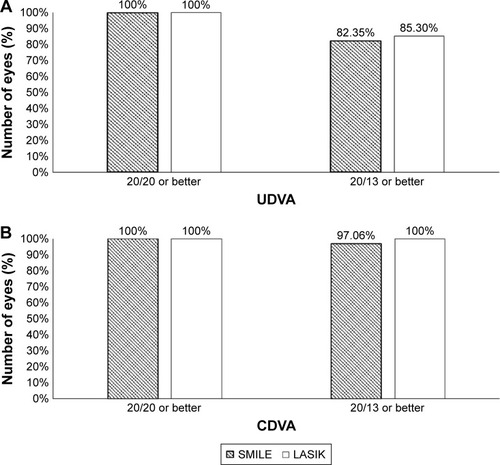
Figure 3 Distribution of the change in Snellen lines of CDVA.
Note: No eyes lost two or more lines of CDVA in either group.
Abbreviations: CDVA, corrected distance visual acuity; SMILE, small incision lenticule extraction.
Abbreviations: CDVA, corrected distance visual acuity; SMILE, small incision lenticule extraction.
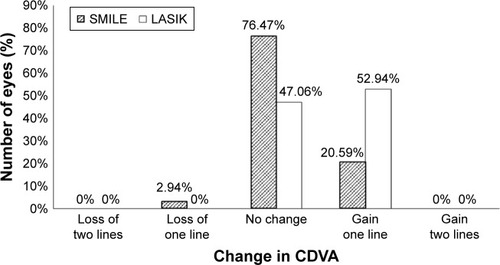
Table 2 Comparison of postoperative refractive outcomes between SMILE and LASIK groups
Figure 4 Comparison of the predictability between the SMILE and LASIK groups.
Note: All cases in SMILE (A) and LASIK (B) groups were accurately corrected to within ±1.00 D, and there were no differences in the ratio of correction to within ±0.5 D between the two groups (C).
Abbreviation: SMILE, small incision lenticule extraction.
Abbreviation: SMILE, small incision lenticule extraction.
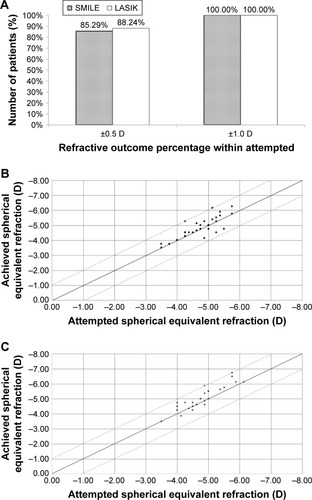
Figure 5 Changes in the refractive power correction efficiency (1st–10th analysis diameter).
Notes: The maintenance ratios at the 8th–10th analysis points in the SMILE group (8th, 83.71%±8.44%; 9th, 74.03%±7.9%; 10th, 63.25%±8.06%) were significantly higher than those in the LASIK group (79.86%±5.83%, 70.43%±6.11%, and 57.7%±6.37%, respectively; p-values being 8th, p=0.0346, 9th, p=0.0392, 10th, p=0.0016). *p<0.05.
Abbreviation: SMILE, small incision lenticule extraction.
Abbreviation: SMILE, small incision lenticule extraction.
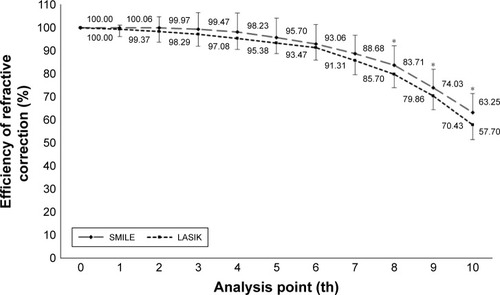
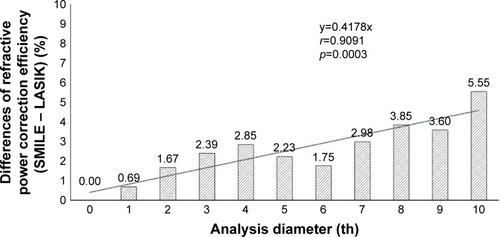
Figure 6 Changes in differences in refractive power correction efficiency (1st–10th analysis diameter) between SMILE and LASIK.
Note: The maintenance ratio in the LASIK group was subtracted from the maintenance ratio in SMILE, which revealed that the difference in maintenance ratios between the SMILE and LASIK groups was positively correlated with the number of analysis points (r=0.91, p=0.0003).
Abbreviation: SMILE, small incision lenticule extraction.
Abbreviation: SMILE, small incision lenticule extraction.