
Figures & data
Figure 1 Icare® TA01i.
Notes: (A) Overview. (B) Measurements for children. Icare TA01i is the most flexible among the four Icare series tonometers because we can measure IOP at various angles. (C) Display shown with IOP.
Abbreviation: IOP, intraocular pressure.
Abbreviation: IOP, intraocular pressure.
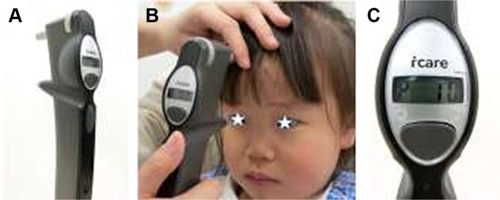
Figure 2 Probes used in Icare® series.
Note: The short probe is only for Icare® PRO, and the long probe is for Icare® TA01i, Icare® HOME, and Icare® ic100.
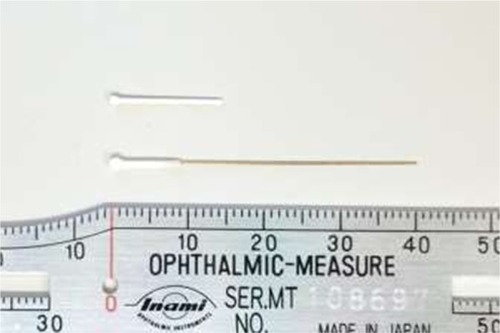
Figure 3 Icare® PRO.
Note: (A) Overview and (B) display panel shown with IOP values and measurement validity with color (green, yellow, and red).
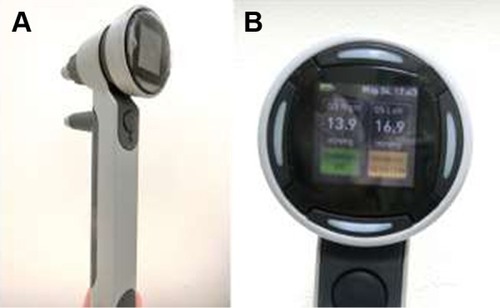
Figure 4 Icare HOME.
Notes: (A) Overview. (B) Green light seen by patients during IOP measurement. (C) Display panel shown with messages.
Abbreviation: IOP, intraocular pressure.
Abbreviation: IOP, intraocular pressure.
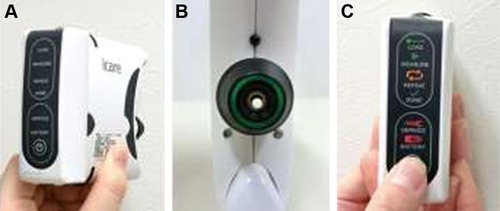
Figure 5 Icare ic100.
Notes: (A) Overview. The green light indicates that the sensor recognizes the position is upright. (B) Color display shown with IOP and validity of measurements (superior, IOP and blue circle means it is the second IOP measurement among six; middle, IOP value after six measurements with a caution [yellow circle]; and inferior results, “repeat”).
Abbreviation: IOP, intraocular pressure.
Abbreviation: IOP, intraocular pressure.
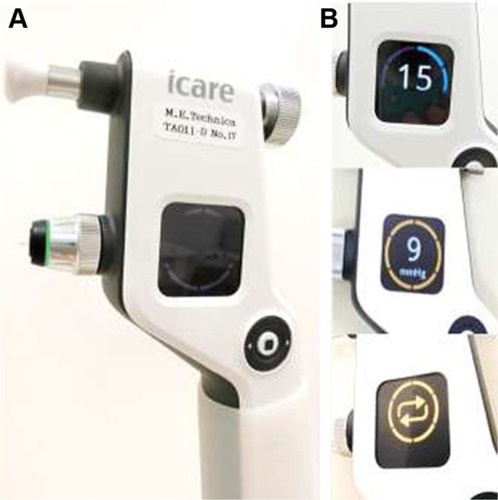
Figure 6 (A) Box plots with mean IOP of Icare ic100 and GAT. IOP was significantly lower with the Icare ic100 than with GAT by about 2.5 mmHg. (B) Scatterplot of IOPs from Icare ic100 and GAT.
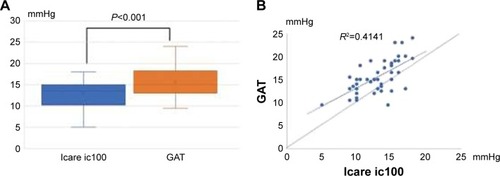
Table 1 Characteristics of Icare rebound tonometers