Figures & data
Table 1 Probability values (N=176)
Table 2 High responders vs low responders average cohort values and P-values
Table 3 Changes in clinical variables
Figure 1 IOP changes (mmHg) from sitting to recumbent positions in this study (N=176 trials).
Abbreviations: IOP, intraocular pressure; PDG, pigmentary dispersion glaucoma; PDS, pigmentary dispersion syndrome.
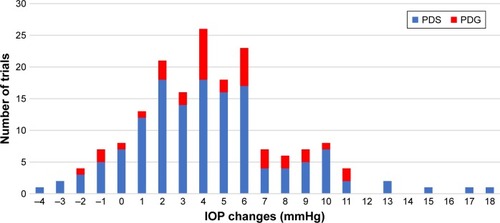
Figure 2 IOP changes (%) from sitting to recumbent positions in this study (N=176 trials).
Abbreviations: IOP, intraocular pressure; PDG, pigmentary dispersion glaucoma; PDS, pigmentary dispersion syndrome.
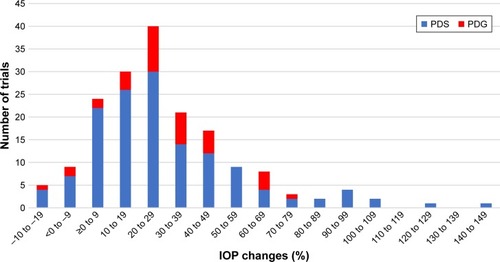
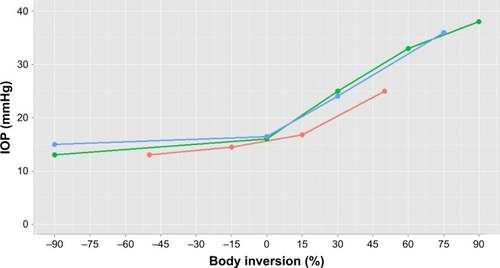
Figure 3 Average IOP values in head up (negative) and down (positive) positions in 3 prior studies.
Notes: The image shows an increasing IOP change with increasing body inversion. Red is Carlson et al,Citation43 green is Linder et al,Citation18 and blue is Tarrkanen and Leikola.Citation48 Head position in degrees – negative = up and positive = down.
Abbreviation: IOP, intraocular pressure.
Abbreviation: IOP, intraocular pressure.