Figures & data
Table 1 Patient demographics
Figure 1 Receiver operating characteristic curves for hydroxychloroquine retin-opathy predicted by dosing guidelines as a univariate analysis.
Abbreviations: IBW, ideal body weight; RBW, real body weight.
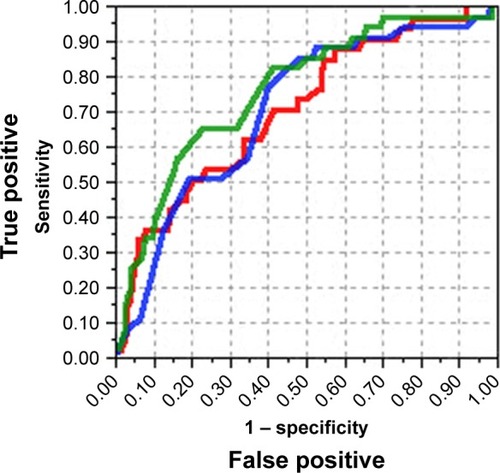
Figure 2 Receiver operating characteristic curves for hydroxychloroquine retin-opathy predicted by dosing guidelines as a multivariate analysis.
Abbreviations: BMI, body mass index; IBW, ideal body weight; RBW, real body weight.
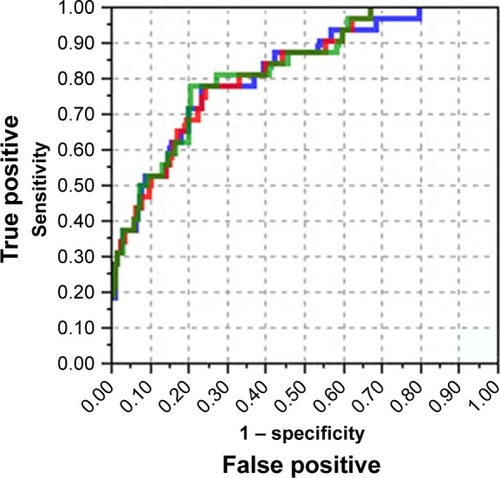
Figure 3 Predicted risk of hydroxychloroquine retinopathy versus BMI from multivariate logistic models with a common base model including gender, age, cumulative dose, and BMI, and differing according to whether the model included dosing guidelines based on RBW (A), IBW (B), or the lesser of RBW and IBW (C).
Abbreviations: BMI, body mass index; IBW, ideal body weight; RBW, real body weight.
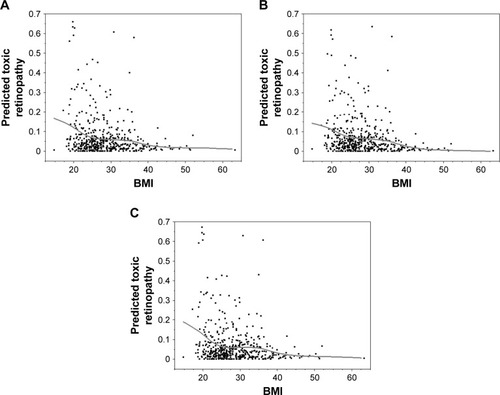
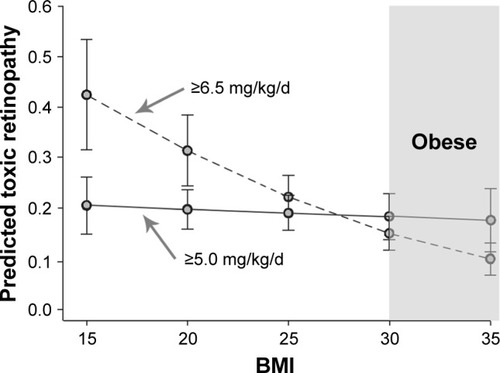
Figure 4 Predicted risk of hydroxychloroquine retinopathy versus BMI from multivariate logistic regression models as described in .
Abbreviation: BMI, body mass index.
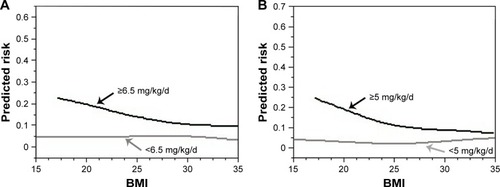
Figure 5 Allocation of patients into zones of safer dosing by the IBW or RBW methods using the IBW algorithm published by Melles and Marmor.Citation6
Abbreviations: IBW, ideal body weight; RBW, real body weight.
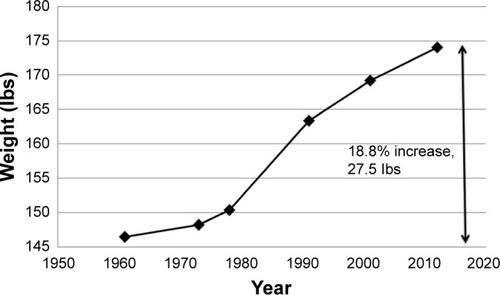
Figure 6 Graph of the average weight for a woman in the age decile 50–59 years in the USA over the time span 1960–2012 from the NHANES.
Abbreviation: NHANES, National Health and Nutrition Examination Survey.

Figure 7 Risk versus body habitus based on ideal body weight and real body weight.
Abbreviation: BMI, body mass index.