Figures & data
Table 1 Baseline patient demographics
Figure 1 Number of anti-VEGF injections received by patients each study year.
Notes: Patients included in the analysis for a particular year received at least one anti-VEGF injection during the year and had data available for a minimum of 50 weeks (year 1), 100 weeks (year 2), or 150 weeks (year 3). Error bars indicate the SD.
Abbreviation: VEGF, vascular endothelial growth factor.
Abbreviation: VEGF, vascular endothelial growth factor.
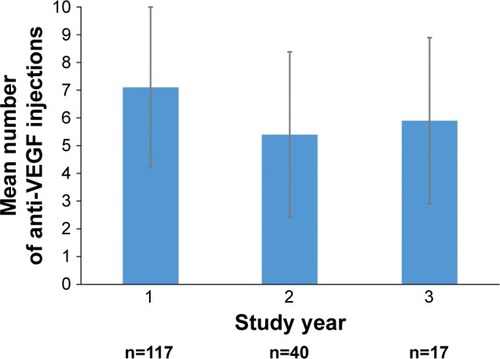
Figure 2 Anti-VEGF injection interval.
Notes: Mean time to next injection was analyzed for all patients who received another anti-VEGF injection within the study period. The number of patients with data for injections 1 through 16 was 163, 162, 157, 143, 127, 114, 99, 82, 73, 63, 50, 46, 38, 34, 31, and 27, respectively.
Abbreviation: VEGF, vascular endothelial growth factor.
Abbreviation: VEGF, vascular endothelial growth factor.
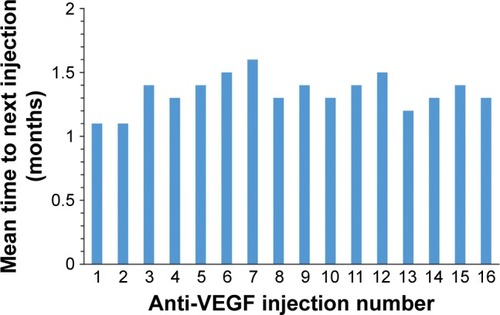
Table 2 Procedures in study eyes during the study period
Figure 3 Percentage of patients who met the primary endpoint after each anti-VEGF injection.
Notes: The primary endpoint was a combined endpoint of both BCVA response (defined as 20/40 or better BCVA) and CRT response (defined as CRT ≤250 μm on TD-OCT or ≤300 μm on SD-OCT) at the same visit. Patients had to have both BCVA and CRT data from the same visit to be included in the analysis. The number of patients with data for injections 0 through 16 was 105, 115, 118, 128, 123, 106, 96, 77, 64, 63, 53, 38, 35, 30, 29, 24, and 23, respectively.
Abbreviations: BCVA, best-corrected visual acuity; CRT, central retinal thickness; SD-OCT, spectral-domain optical coherence tomography; TD-OCT, time-domain optical coherence tomography; VEGF, vascular endothelial growth factor.
Abbreviations: BCVA, best-corrected visual acuity; CRT, central retinal thickness; SD-OCT, spectral-domain optical coherence tomography; TD-OCT, time-domain optical coherence tomography; VEGF, vascular endothelial growth factor.
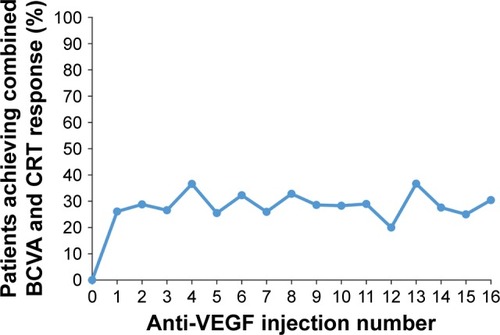
Figure 4 Percentage of patients with 20/40 or better BCVA after each anti-VEGF injection.
Note: The number of patients with BCVA data after injections 0 through 16 was 133, 139, 141, 141, 134, 120, 107, 86, 74, 65, 56, 44, 36, 31, 32, 25, and 25, respectively.
Abbreviations: BCVA, best-corrected visual acuity; VEGF, vascular endothelial growth factor.
Abbreviations: BCVA, best-corrected visual acuity; VEGF, vascular endothelial growth factor.
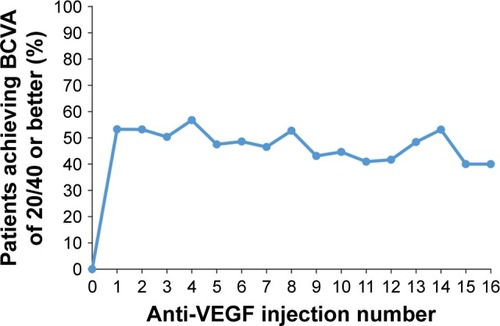
Figure 5 Percentage of patients with CRT ≤250 μm on TD-OCT or ≤300 μm on SD-OCT after each anti-VEGF injection.
Note: The number of patients with CRT data after injections 0 through 16 was 128, 133, 134, 145, 137, 115, 104, 85, 74, 74, 58, 46, 42, 36, 33, 28, and 27, respectively.
Abbreviations: CRT, central retinal thickness; SD-OCT, spectral-domain optical coherence tomography; TD-OCT, time-domain optical coherence tomography; VEGF, vascular endothelial growth factor.
Abbreviations: CRT, central retinal thickness; SD-OCT, spectral-domain optical coherence tomography; TD-OCT, time-domain optical coherence tomography; VEGF, vascular endothelial growth factor.
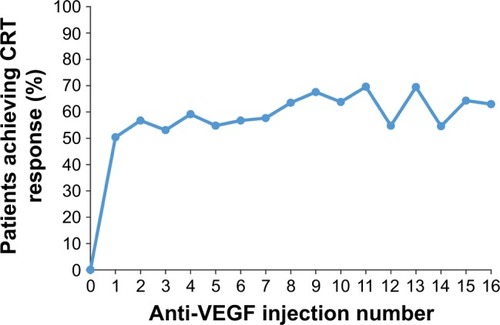
Figure 6 Mean change in BCVA from baseline after each anti-VEGF injection.
Notes: The number of patients with change from baseline BCVA data after injections 1 through 16 was 116, 115, 118, 109, 101, 89, 73, 66, 58, 49, 36, 34, 25, 27, 23, and 22, respectively. *P≤0.031.
Abbreviations: BCVA, best-corrected visual acuity; ETDRS, Early Treatment Diabetic Retinopathy Study; VEGF, vascular endothelial growth factor.
Abbreviations: BCVA, best-corrected visual acuity; ETDRS, Early Treatment Diabetic Retinopathy Study; VEGF, vascular endothelial growth factor.
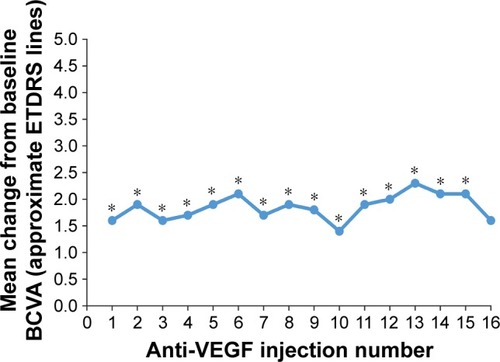
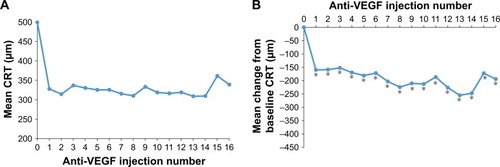
Figure 7 Mean CRT (A) and mean change in CRT from baseline (B) after each anti-VEGF injection.
Notes: The number of patients with CRT data after injections 0 through 16 was 128, 133, 134, 145, 137, 115, 104, 85, 74, 74, 58, 46, 42, 36, 33, 28, and 27, respectively. The number of patients with change from baseline CRT data after injections 1 through 16 was 110, 110, 117, 109, 93, 85, 70, 63, 65, 48, 40, 36, 29, 27, 22, and 21, respectively. *P≤0.039.
Abbreviations: CRT, central retinal thickness; VEGF, vascular endothelial growth factor.
Abbreviations: CRT, central retinal thickness; VEGF, vascular endothelial growth factor.