Figures & data
Table 1 Preoperative comparison of eyes in both groups
Figure 1 Six-month postoperative UDVA versus preoperative CDVA.
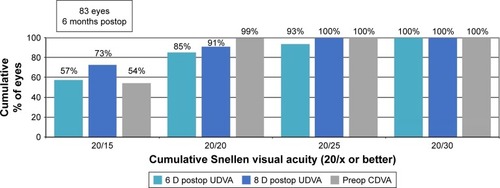
Figure 2 Twelve-month postoperative UDVA versus preoperative CDVA.
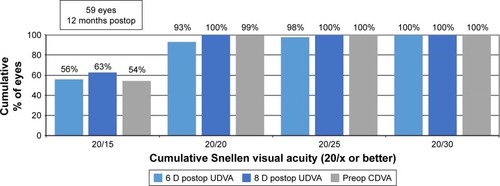
Figure 3 Percentage of eyes at 6 months postoperatively that lost or gained lines of Snellen corrected distance visual acuity (CDVA).
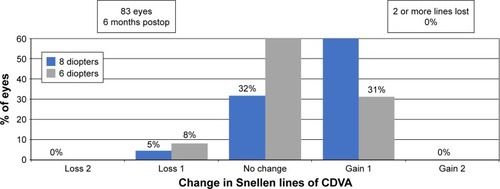
Figure 4 Percentage of eyes at 12 months postoperatively that lost or gained lines of Snellen CDVA.
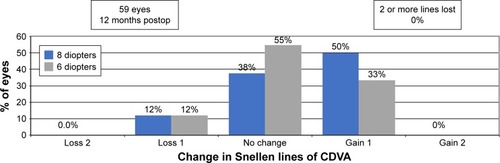
Figure 5 Six-month postoperative spherical equivalent refractive accuracy.
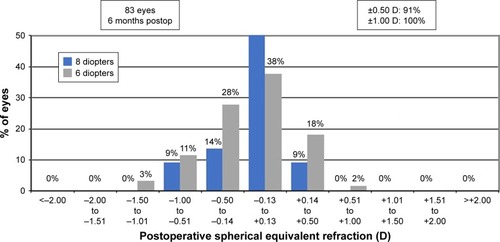
Figure 6 Twelve-month postoperative spherical equivalent refractive accuracy.
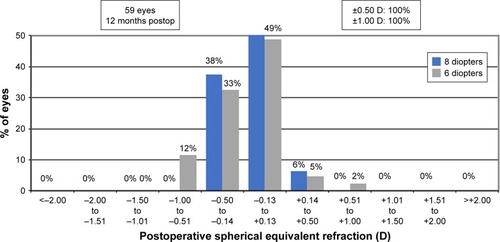
Figure 7 Twelve-month postoperative predictability of SE with achieved SE (y-axis) and attempted SE (x-axis).
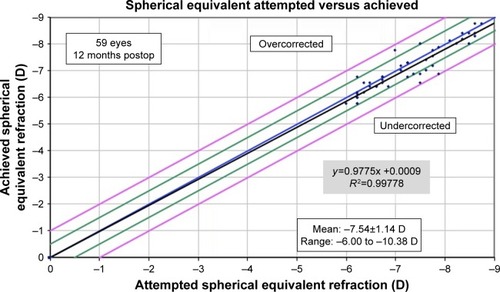
Figure 8 Preoperative and 12-month postoperative refractive astigmatism with percentage of eyes (y-axis) versus refractive astigmatism (diopters [D]) on the x-axis.
![Figure 8 Preoperative and 12-month postoperative refractive astigmatism with percentage of eyes (y-axis) versus refractive astigmatism (diopters [D]) on the x-axis.](/cms/asset/ccd5c304-6794-4059-a3d5-a6c31a1d8a24/doph_a_164110_f0008_c.jpg)
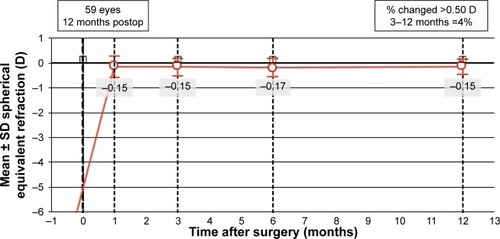
Figure 9 Stability of spherical equivalent refraction in diopters (D) at 1, 3, 6, and 12 months.