Figures & data
Figure 1 OCT scan of the choroid using Spectralis.
Note: Choroidal thickness was measured in the fovea and at 500 μm intervals nasal and temporal to the fovea (yellow lines).
Abbreviation: OCT, optical coherence tomography.
Abbreviation: OCT, optical coherence tomography.
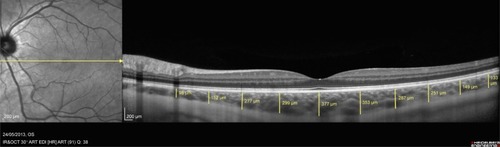
Table 1 Characteristics of subjects
Table 2 Mean choroidal thickness between groups in 10 locations
Figure 2 Sectorized analysis of choroidal thickness using the ETDRS macular grid.
Abbreviations: CS, central subfield; ETDRS, Early Treatment Diabetic Retinopathy Study; II, inner inferior; IN, inner nasal; IS, inner superior; IT, inner temporal; OI, outer inferior; ON, outer nasal; OS, outer superior; OT, outer temporal; UAE, urinary albumin excretion.
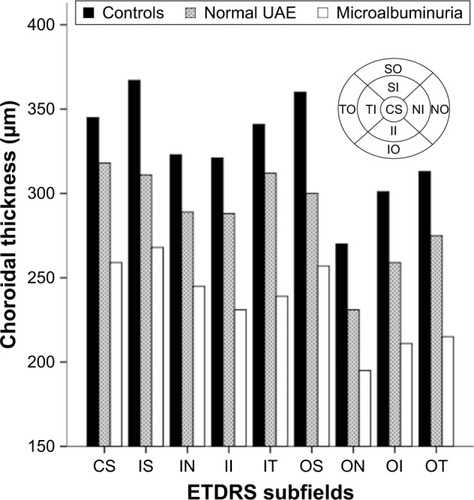
Figure 3 Graphic showing average choroidal volume in the macula in each group.
Abbreviations: ETDRS, Early Treatment Diabetic Retinopathy Study; UAE, urinary albumin excretion.
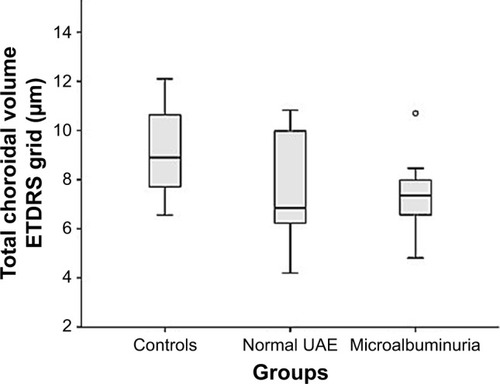
Figure 4 Colored topographic map of thickness of the posterior pole generated manually from (A) controls, (B) normal UAE group and (C) microalbuminuric group.
Abbreviation: UAE, urinary albumin excretion.
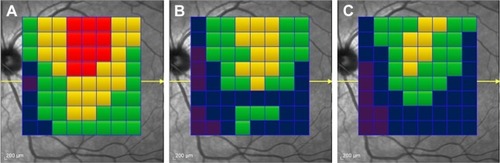
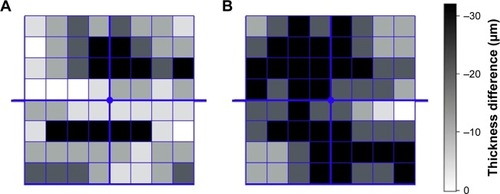
Figure 5 Thickness difference map of controls compared to (A) normal UAE group and (B) microalbuminuric group.
Abbreviation: UAE, urinary albumin excretion.