Figures & data
Table 1 Baseline characteristics
Table 2 Treatment
Table 3 ETDRS
Figure 1 ETDRS BCVA.
Notes: Boxplots show median, first and third quartile, upper/lower whisker extends from the hinge to the largest/smallest value no further than 1.5×IQR from the hinge. Dots indicate individual values.
Abbreviations: BCVA, best corrected visual acuity; ETDRS, Early Treatment Diabetic Retinopathy Study; IQR, interquartile range; PDT, photodynamic therapy; ZivA, ziv-aflibercept and aflibercept.
Abbreviations: BCVA, best corrected visual acuity; ETDRS, Early Treatment Diabetic Retinopathy Study; IQR, interquartile range; PDT, photodynamic therapy; ZivA, ziv-aflibercept and aflibercept.
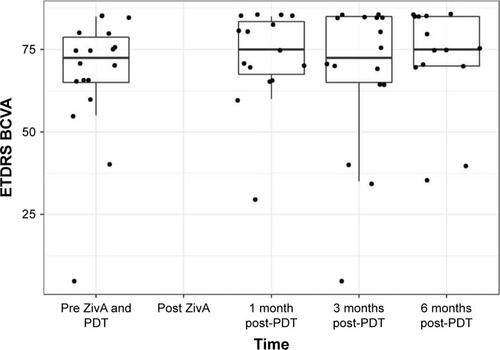
Table 4 sSRF
Figure 2 Subfoveal SRF.
Notes: Boxplots show median, first and third quartile, upper/lower whisker extends from the hinge to the largest/smallest value no further than 1.5×IQR from the hinge. Dots indicate individual values.
Abbreviations: IQR, interquartile range; PDT, photodynamic therapy; SRF, subretinal fluid; ZivA, ziv-aflibercept and aflibercept.
Abbreviations: IQR, interquartile range; PDT, photodynamic therapy; SRF, subretinal fluid; ZivA, ziv-aflibercept and aflibercept.
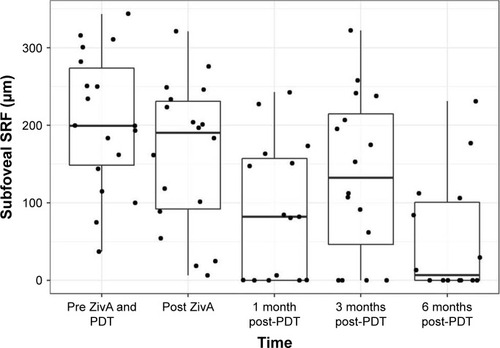
Table 5 mSRF
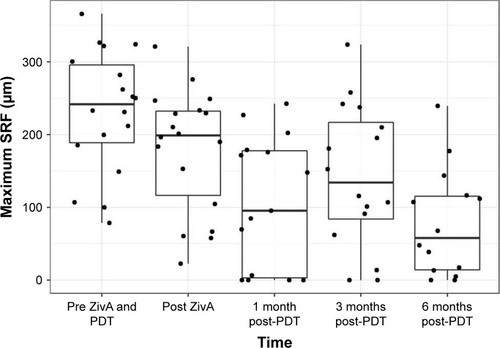
Figure 3 Maximum SRF.
Notes: Boxplots show median, first and third quartile, upper/lower whisker extends from the hinge to the largest/smallest value no further than 1.5×IQR from the hinge. Dots indicate individual values.
Abbreviations: IQR, interquartile range; PDT, photodynamic therapy; SRF, subretinal fluid; ZivA, ziv-aflibercept and aflibercept.
Abbreviations: IQR, interquartile range; PDT, photodynamic therapy; SRF, subretinal fluid; ZivA, ziv-aflibercept and aflibercept.