Figures & data
Figure 1 Exponential model parameters.
Note: Three-parameter exponential model showing the baseline cone threshold (c), recovery half-life (h), and intercept (a) used to fit cone data.
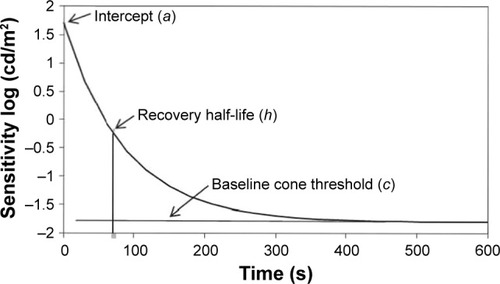
Table 1 Demographics of the subject population
Figure 2 Threshold data and least squares fit exponential model.
Note: Threshold data and least squares fit exponential model for AMD subject R2 values (0.91, 0.93, and 0.88) and for older normal subject R2 values (0.89, 0.92, and 0.91) for visits 2, 3, and 4, respectively.
Abbreviation: AMD, age-related macular degeneration.
Abbreviation: AMD, age-related macular degeneration.
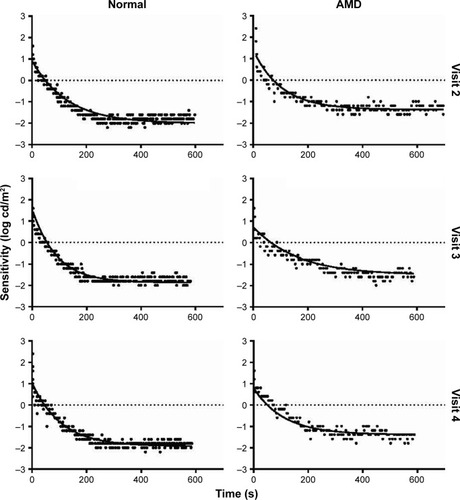
Figure 3 Baseline cone threshold.
Notes: ANOVA with the Satterthwaite approximation and Tukey–Kramer p-value adjustment was used to compare normal young and old subjects as well as age-matched older normal and AMD subjects. Scatterplot with error bars representing the standard deviation.
Abbreviations: AMD, age-related macular degeneration; ANOVA, analysis of variance.
Abbreviations: AMD, age-related macular degeneration; ANOVA, analysis of variance.
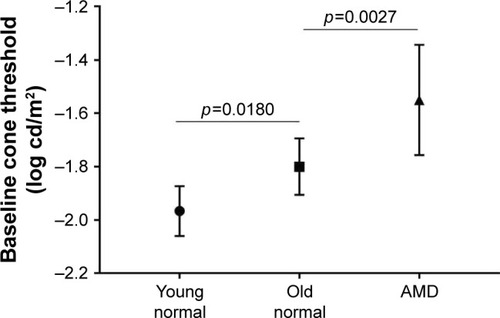
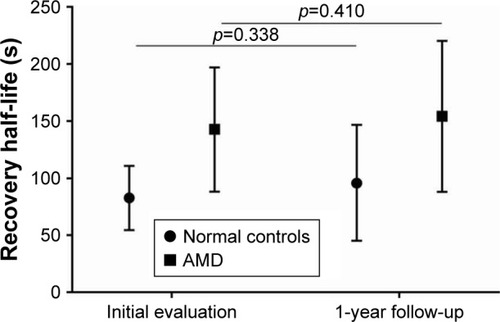
Figure 4 Recovery half-life.
Notes: ANOVA with the Satterthwaite approximation and Tukey–Kramer p-value adjustment was used to compare normal young and old subjects as well as age-matched older normal and AMD subjects. Scatterplot with error bars representing the standard deviation.
Abbreviations: AMD, age-related macular degeneration; ANOVA, analysis of variance.
Abbreviations: AMD, age-related macular degeneration; ANOVA, analysis of variance.
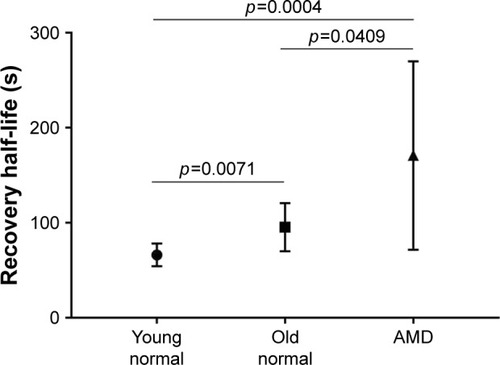
Figure 5 Baseline cone threshold change for repeated subjects.
Notes: Baseline cone threshold means were compared from the baseline year to the 1-year follow-up using Satterthwaite ANOVA; error bars represent the standard deviation.
Abbreviations: AMD, age-related macular degeneration; ANOVA, analysis of variance.
Abbreviations: AMD, age-related macular degeneration; ANOVA, analysis of variance.
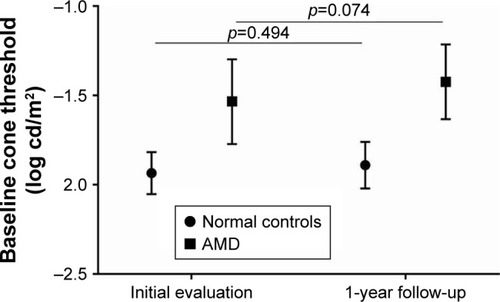
Figure 6 Recovery half-life change for repeated subjects.
Notes: Recovery half-life means were compared from baseline year to 1-year follow-up using Satterthwaite ANOVA; error bars represent the standard deviation.