
Figures & data
Table 1 Clinical characteristics of 27 patients with rhegmatogenous retinal detachment
Figure 1 Bland–Altman plot between preoperative and postoperative axial length obtained by A-scan biometry.
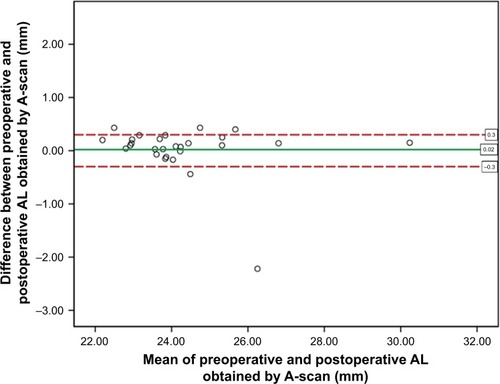
Figure 2 Bland–Altman plot between preoperative and postoperative axial length obtained by optical biometry.
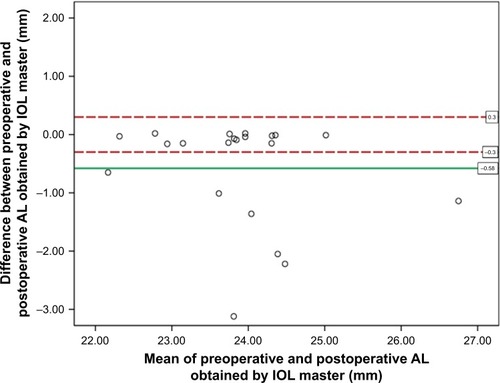
Table 2 Preoperative and postoperative mean AL obtained by IOL master and immersion A-scan ultrasound (n = 27)
Figure 3 Bland–Altmand plot between preoperative and postoperative axial length obtained by A-scan in the subgroup of macula on rhegmatogenous retinal detachment.
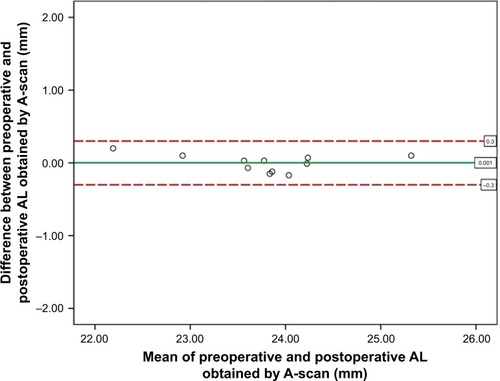
Figure 4 Bland–Altman plot between preoperative and postoperative axial length obtained by optical biometry in the subgroup of macula on rhegmatogenous retinal detachment.
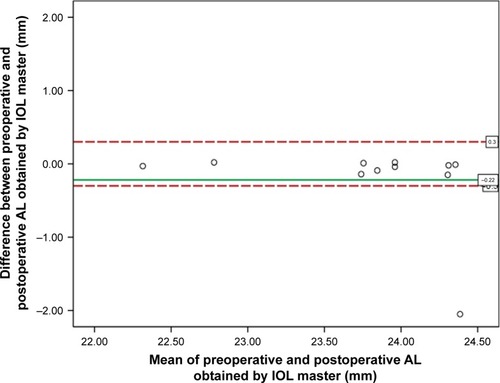
Table 3 Preoperative and postoperative mean AL obtained by IOL master and immersion A-scan ultrasound of macula-on rhegmatogenous retinal detachment (n = 11)
Table 4 Preoperative and postoperative mean AL obtained by IOL master and immersion A-scan ultrasound of 16 patients with macula-off rhegmatogenous retinal detachment