Figures & data
Figure 1 Sample size per stratum.
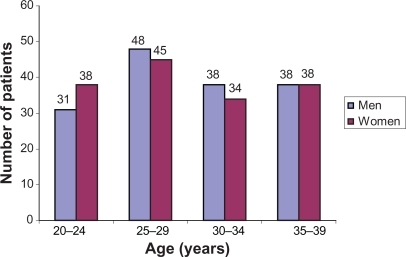
Figure 2 Distribution of central corneal thickness in the sample.
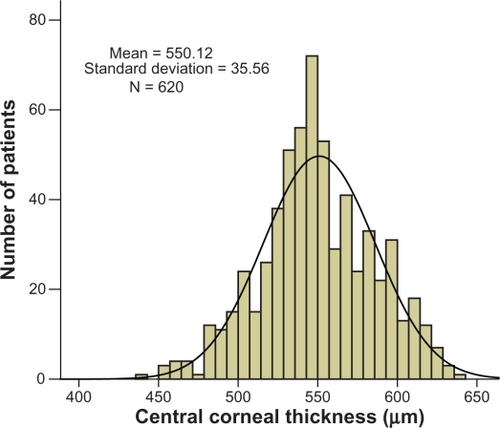
Figure 3 Comparison of central corneal thickness (CCT) values between right and left eyes in the sample.
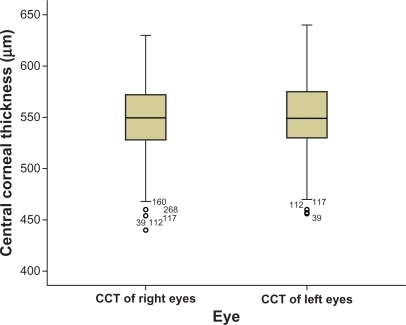
Figure 4 Comparison of central corneal thickness values between women and men in the sample.
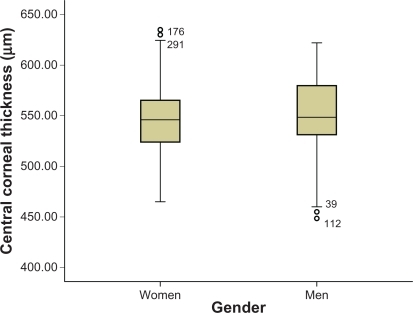
Figure 5 Comparison of central corneal thickness values among age groups.
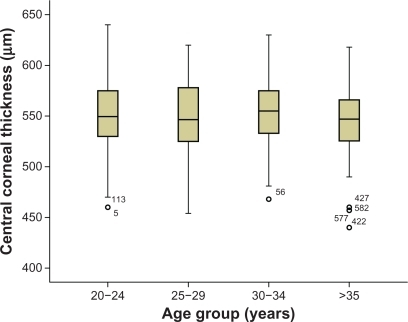
Figure 6 Distribution of intraocular pressure (IOP) in the sample.
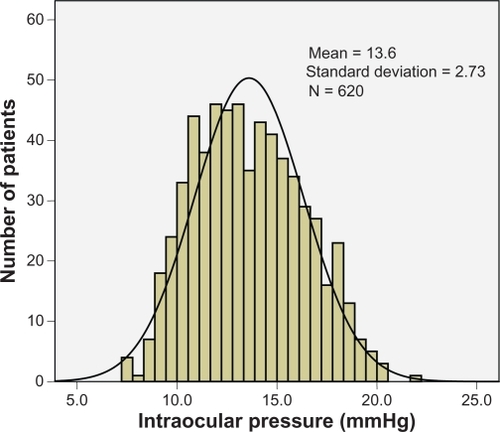
Figure 7 Comparison of intraocular pressure (IOP) values between right and left eyes in the sample.
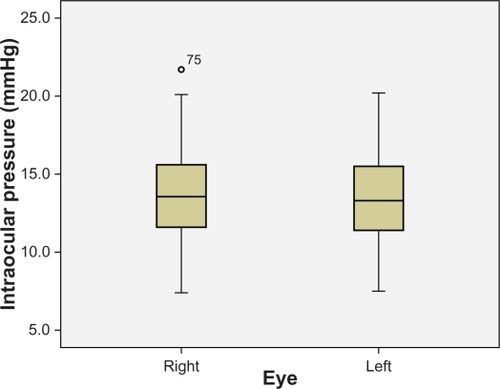
Figure 8 Comparison of intraocular pressure (IOP) values between women and men in the sample.
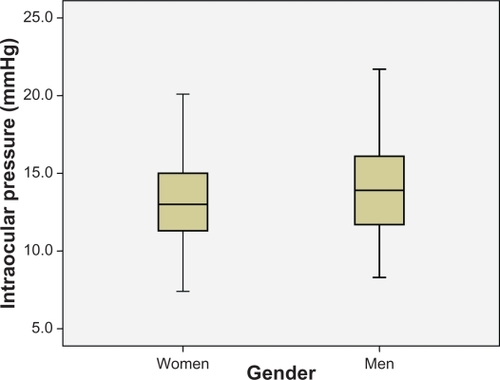
Figure 9 Comparison of intraocular pressure (IOP) values among age groups.
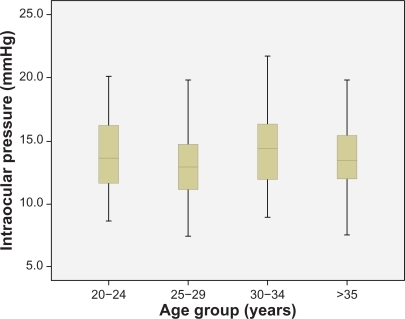
Figure 10 Comparison of intraocular pressure (IOP) values between patients of groups under and over 30 years of age.
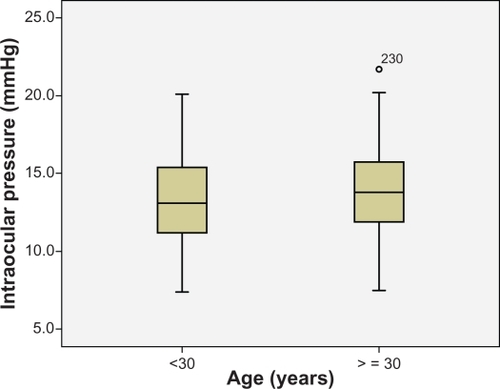
Figure 11 Distribution of myopia in the sample.
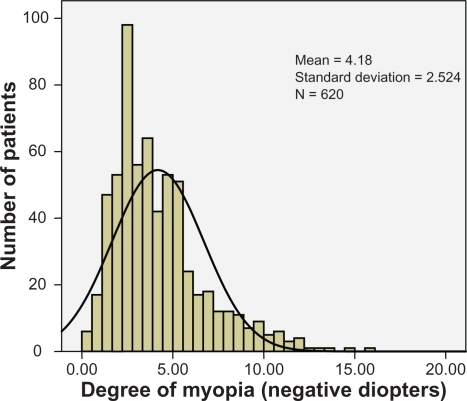
Figure 12 Comparison of myopia values between right and left eyes in the sample.
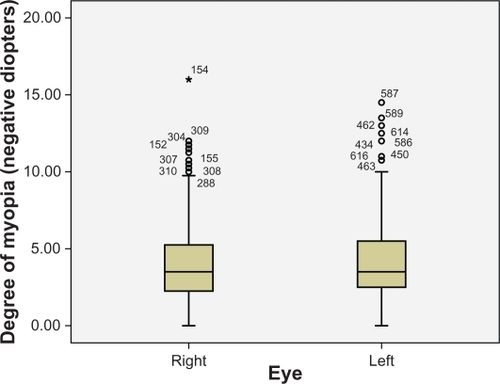
Figure 13 Comparison of myopia values between women and men in the sample.
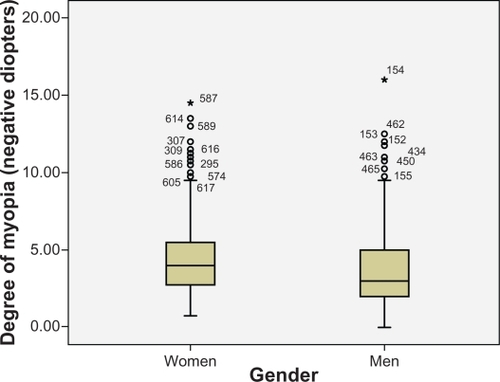
Figure 14 Comparison of myopia values among age groups.
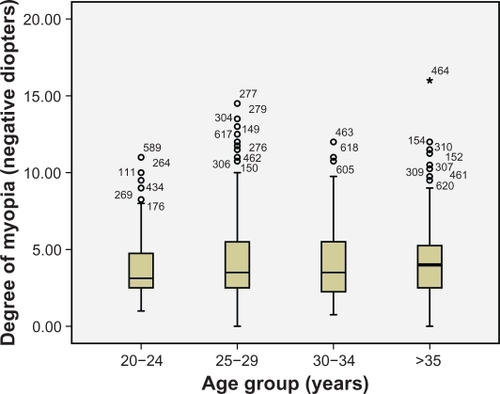
Figure 15 Scatterplot showing how much intraocular pressure (IOP) is affected by central corneal thickness (CCT) in the sample.
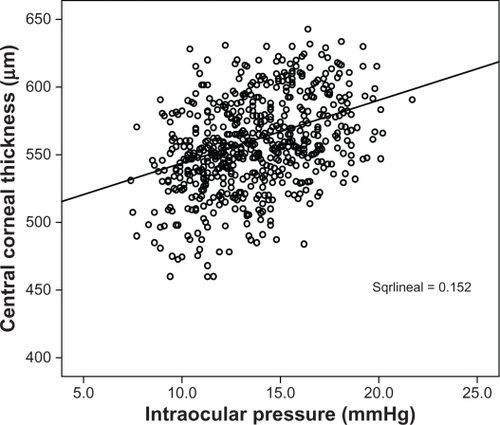
Figure 16 Scatterplot showing the relationship between myopia and intraocular pressure (IOP).
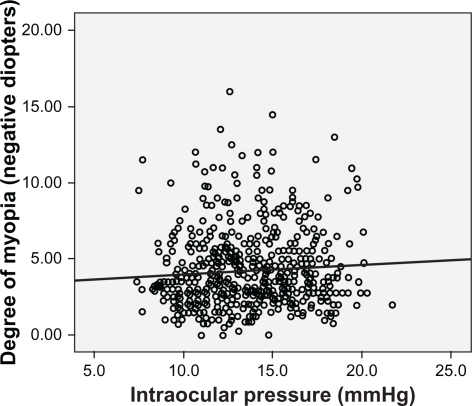
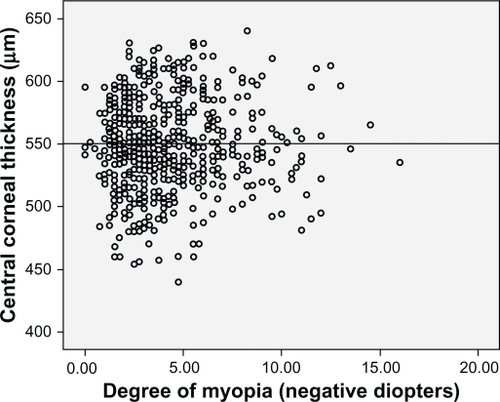
Figure 17 Scatterplot showing the relationship between myopia and central corneal thickness (CCT).