Figures & data
Table 1 Subject demographics comparing those who had a single examination and those who returned for a second examination
Figure 1 Histogram of age for the entire cohort of subjects at the time of their first examination.
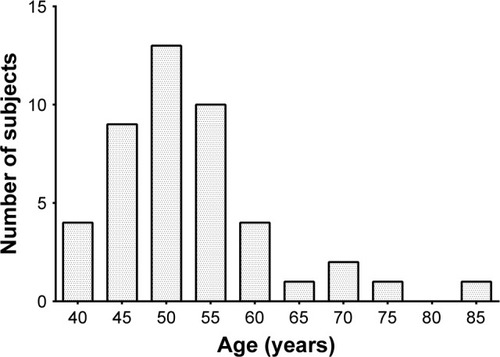
Figure 2 Representative VEP report generated by the Diopsys NOVA device.
Abbreviations: VEP, visual evoked potential; uv, microvolt; ms, millisecond; OD, right eye; OS, left eye; VA, visual acuity; Lc, low contrast; Hc, high contrast.
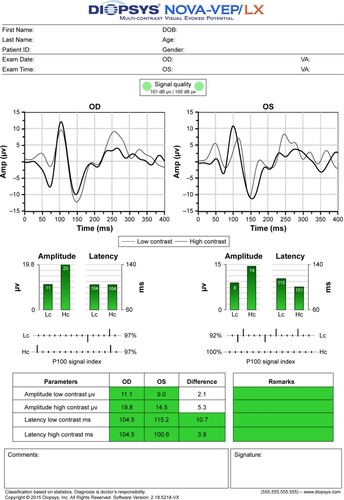
Table 2 Mean P100 parameters at first examination
Table 3 Intrasession repeatability outcomes
Figure 3 Mean P100 parameters for each of the three trials at the first examination session.
Abbreviations: RLCA, low contrast amplitude, right eye; LLCA, low contrast amplitude, left eye; RHCA, high contrast amplitude, right eye; LHCA, high contrast amplitude, left eye; RLCL, low contrast latency, right eye; LLCL, low contrast latency, left eye; RHCL, high contrast latency, right eye; LHCL, high contrast latency, left eye.
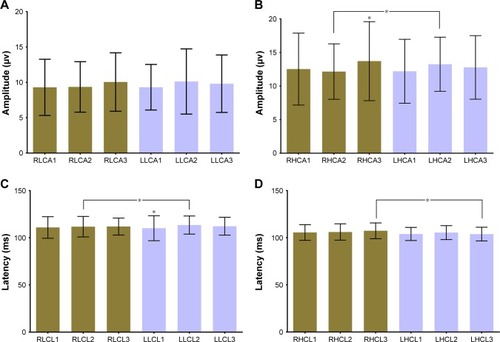
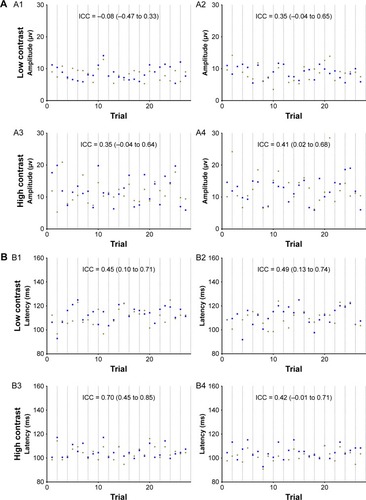
Figure 4 (A) Serial P100 amplitude recordings and (B) serial P100 latency recordings for each of the 46 subjects at the first examination.
Abbreviation: ICC, intraclass correlation coefficient.
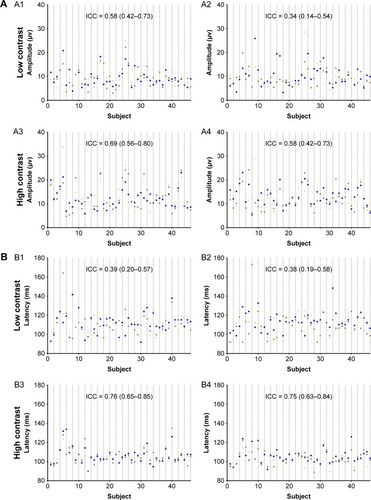
Figure 5 Bland–Altman plots of P100 parameter limits of agreement between fellow eyes at visit 1.
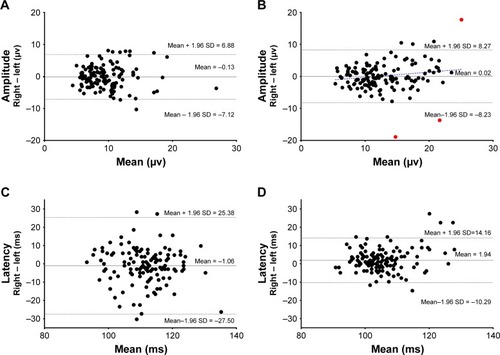
Table 4 P100 amplitude and latency by age, sex, and ethnicity
Table 5 Coefficient of variation for P100 parameters by age, sex, and ethnicity
Table 6 P100 parameters of the returning subjects
Figure 6 Bland–Altman plots of intersession P100 parameter limits of agreement.
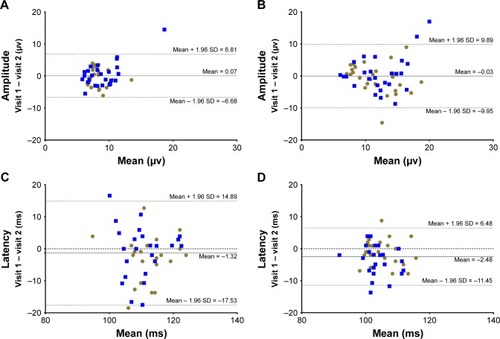
Table 7 Intersession repeatability values
Figure 7 (A) P100 amplitude recordings and (B) P100 latency recordings for each of the 27 recordings performed on nine returning subjects at the first (circle) and second (square) examination sessions.
Abbreviation: ICC, intraclass correlation coefficient.