Figures & data
Table 1 Patient characteristics
Figure 1 Microbial differences between adult and pediatric samples.
Abbreviations: OTU, Operational Taxonomic Unit; pCoA, principal coordinate analysis; PD, phylogenetic diversity.
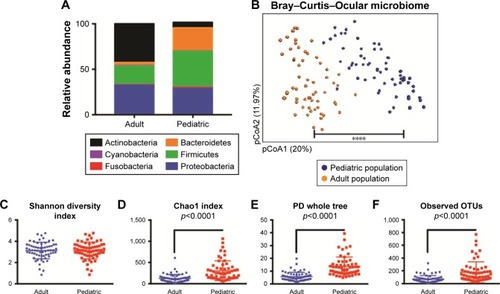
Figure 2 OSM is paucibacterial in adults, but not in children.
Abbreviations: OSM, ocular surface microbiome; pCoA, principal coordinate analysis.
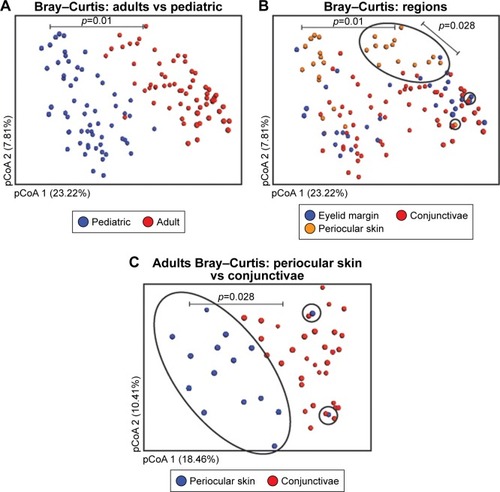
Figure 3 OSM composition is comparable between the two eyes and for various clinical parameters.
Abbreviations: OSM, ocular surface microbiome; pCoA, principal coordinate analysis.
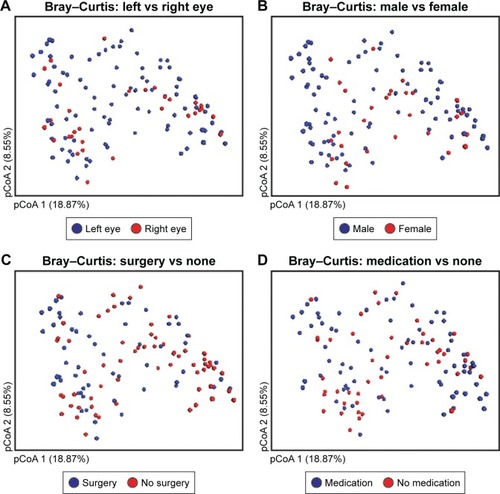
Figure S1 (A) Average 100% stacked graph of six major phyla as it compares within the adult and pediatric samples. Except Cyanobacteria, which remains unchanged between the age groups (stacked at 5%), and Fusobacteria with higher relative abundance in adults, all other phyla exhibit higher relative abundance in the pediatric samples. (B) Unweighted unifrac distance calculations for pCoA plot.
Notes: Distance between the groups is significantly higher compared to distance within individual groups. Test of significance – Monte Carlo permutation with Bonferroni correction. ****p<0.001.
Abbreviation: pCoA, principal coordinate analysis.
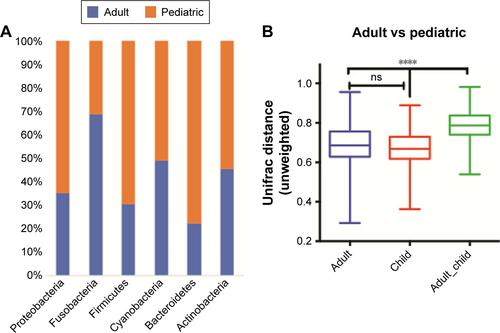
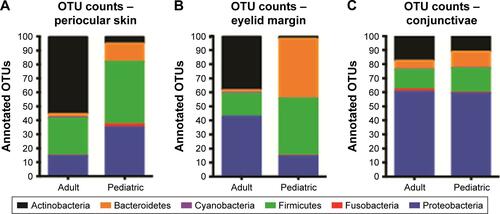
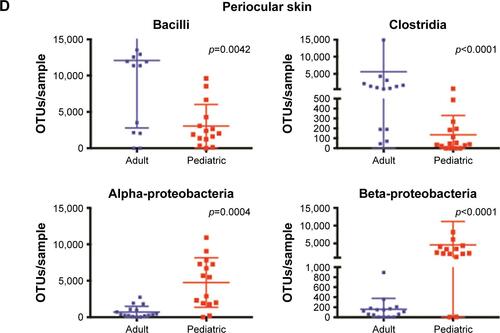
Figure S2 Phylum-wise absolute OTU counts from (A) periocular skin, (B) eyelid margin, and (C) conjunctivae. (D) Periocular skin microbiome class spread in individual adult and pediatric samples.
Notes: There is a relative expansion of Bacilli and Clostridia in adults at the expense of alpha- and beta-proteobacteria. Test of significance – nonparametric Mann–Whitney U-test.
Abbreviation: OTU, Operational Taxonomic Unit.