
Figures & data
Figure 1 Measurements of choroidal thickness at 10 locations.
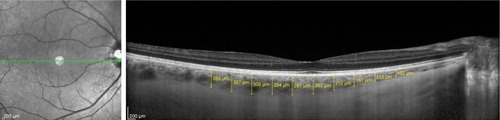
Table 1 Demographic and clinical characteristics of the study and control groups
Table 2 Comparison of CT measurements of all groups; adjusted for the presence of hypertension
Table 3 Comparison of CT measurements of pregnant patients with GDM, type 1 DM and type 2 DM, adjusted for HbA1c values and for the presence of hypertension
Table 4 Comparison of CT measurements of pregnant patients with type 1 DM and type 2 DM; adjusted for HbA1c values and the presence of hypertension