
Figures & data
Figure 1 Clinical examinations of a subject without glaucoma (A) and with glaucoma (B) are shown.
Notes: Fundus photography (a), VF testing (f), conventional OCTA (b–e), and EDI-OCTA (g–j). Blood flow in B-scan images is represented in red (c, d, h, and i). The images shown in (d and i) are magnified views of the green square in images (c and h) and show that EDI-OCTA detects more deep layer signals than conventional OCTA (red arrowheads). Binarized images (e and j; vessels shown in yellow) were analyzed for VD inside the ONH (yellow circle).
Abbreviations: EDI-OCTA, enhanced-depth imaging optical coherence tomography angiography; ONH, optic nerve head; VD, vessel density; VF, visual field.
Abbreviations: EDI-OCTA, enhanced-depth imaging optical coherence tomography angiography; ONH, optic nerve head; VD, vessel density; VF, visual field.
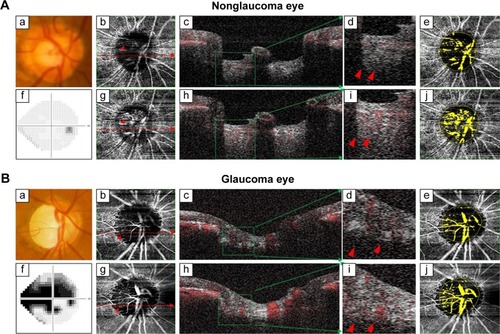
Table 1 Subject demographic and ocular characteristics
Figure 2 VD measurements obtained with conventional imaging (dark gray) and EDI-OCTA (light gray).
Notes: Median disc VD in subjects without glaucoma was 23.2% (25th, 75th percentile: 21.0%, 30.3%) with conventional imaging and 29.4% (27.0%, 35.7%) with EDI. Disc VD was measured to be 19.3% (17.0%, 22.3%) with conventional imaging and 26.0% (23.6%, 27.7%) with EDI in subjects with glaucoma. *Mann–Whitney U-test. **Wilcoxon signed-rank test. Error bar represented as standard error and box represented as median (quantiles). “×” represented as mean value.
Abbreviations: EDI-OCTA, enhanced-depth imaging optical coherence tomography angiography; VD, vessel density.
Abbreviations: EDI-OCTA, enhanced-depth imaging optical coherence tomography angiography; VD, vessel density.
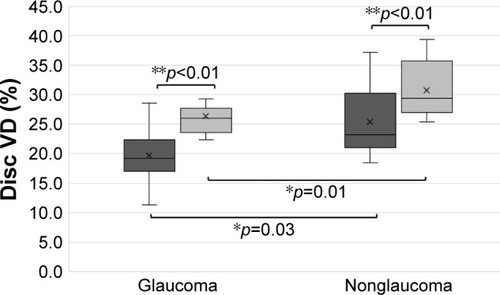
Figure 3 Scatter plot showing the relationship between VD and VF MD in subjects with conventional OCTA (A) and EDI-OCTA (B).
Notes: The correlation between these parameters was statistically significant for both conventional OCTA (R2=0.27, p=0.02) and EDI-OCTA (R2=0.22, p=0.02). Additionally, correlations were comparable between conventional and EDI measurements.
Abbreviations: EDI-OCTA, enhanced-depth imaging optical coherence tomography angiography; MD, mean deviation; VD, vessel density; VF, visual field.
Abbreviations: EDI-OCTA, enhanced-depth imaging optical coherence tomography angiography; MD, mean deviation; VD, vessel density; VF, visual field.
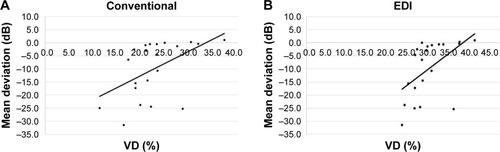
Table 2 Univariate regression analysis for factors affecting MD value