Figures & data
Figure 1 Example of fluorescein angiography guidance of macular laser photocoagulation (A) showing the leaking area of the macula (surrounded by arrowheads). The equivalent color fundus photograph (B) is used to show the laser spot location mapping (blue asterisks).
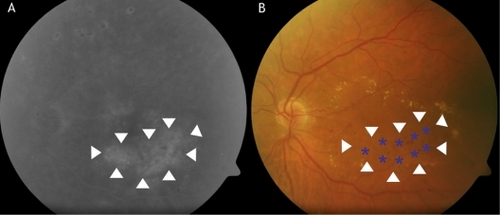
Figure 2 Example of spectral-domain optical coherence tomography (SD-OCT) guidance of macular laser photocoagulation. Retinal thickness color map (A) obtained by SD-OCT software; a fundus photograph (B) is also registered; finally, a composition of the map superimposed and aligned on the fundus image is provided automatically by SD-OCT (C). The equivalent color fundus photograph (D) is used to show the laser spot location mapping (blue asterisks) avoiding the foveal area.
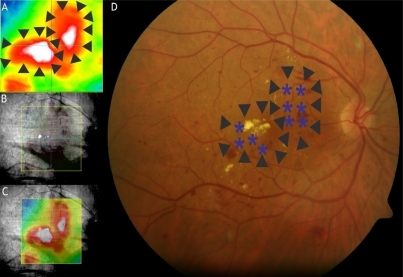
Table 1 Baseline and endpoint characteristics of patients assigned to macular laser photocoagulation guided by fluorescein angiography findings
Table 2 Baseline and endpoint characteristics of the patients assigned to macular laser photocoagulation guided by SD-OCT retinal thickness map