Figures & data
Figure 1 The mean blur rate (MBR) displayed as a 2D color-coded map. (A) MBR at the disc as the retinal blood flow, which was calculated automatically after circling the margin of the optic disc with a rubber band (▲). Since the MBR in the vessel area (MV) includes the MBR in the tissue area (MT), the MBR (MV-MT) was used as the retinal blood flow. (B) MBR at the macula which calculated automatically after configured isometric areas compared MBR maps with fundus photographs was used as the choroidal blood flow.
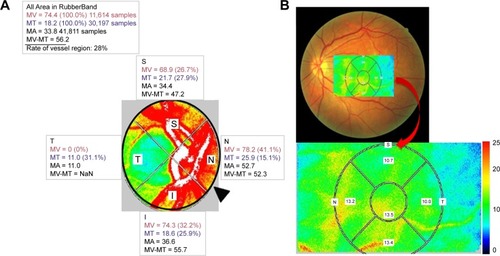
Table 1 Demographics of patients with diabetic macular edema
Table 2 Changes in visual parameters over time
Figure 2 (A) Change in the best-corrected visual acuity (BCVA). BCVA was significantly improved in the treated group at 3 and 6 months from baseline (*P<0.05) and remained unchanged in the untreated group. (B) Change in the central retinal thickness (CRT). CRT was significantly improved during the whole follow-up period in both groups (*P<0.05). There was no significant difference between the two groups. (C) Change in the subfoveal choroidal thickness (SCT). SCT was significantly reduced during the whole follow-up period in the treated group (*P<0.05). On the other hand, SCT was significantly reduced only at 1 month from baseline in the untreated group (*P<0.05).
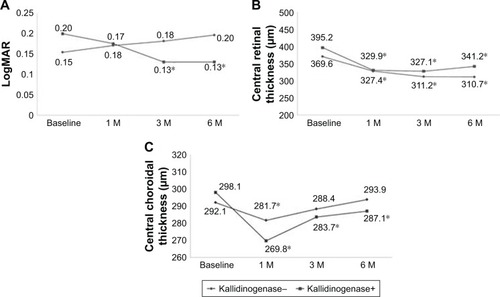
Figure 3 (A) Change in the mean blur rate (MBR) at the disc as the retinal blood flow. Although the retinal blood flow significantly decreased in the untreated group at 3 and 6 months from baseline (*P<0.05), it remained unchanged during the whole follow-up period in the treated group. (B) Change in MBR at the macula as the choroidal blood flow. Although the choroidal blood flow significantly decreased in the untreated group at 6 months from baseline (*P<0.05), it remained unchanged during the whole follow-up period in the treated group. There was a significant difference between the two groups after 6 months (§P<0.05).
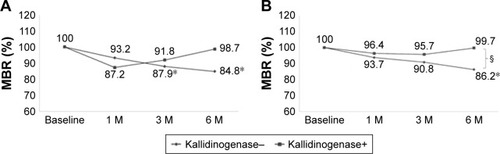
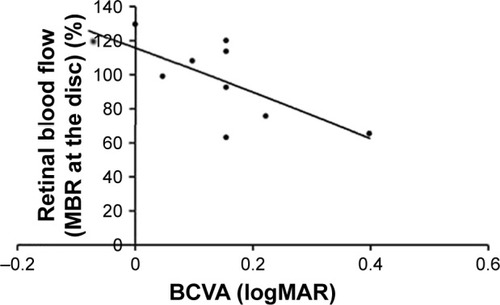
Figure 4 Spearman’s correlation between the mean blur rate (MBR) at the disc and the best-corrected visual acuity (BCVA). Significant negative correlation between BCVA and retinal blood flow was noted in the treated group at 6 months (P=0.01).