Figures & data
Table 1 Patient characteristics according to treatment sequence
Table 2 Ocular comorbidities according to treatment sequence: reported numbers (%)
Table 3 General comorbidities according to treatment sequence: reported numbers (%)
Table 4 Percentages of patients persisting with travoprost/travoprost-timolol, latanoprost/latanoprost–timolol, or bimatoprost/bimatoprost–timolol as monotherapy, ranked according to treatment duration
Figure 1 Time to treatment failure for travoprost/travoprost–timolol, latanoprost/latanoprost–timolol, and bimatoprost/bimatoprost–timolol (follow-up was censored at 65 months).
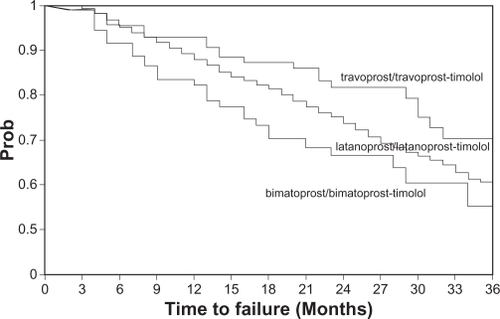
Table 5 Average monthly glaucoma costs according to treatment sequence (£)