
Figures & data
Table 1 Preoperative refractive and biometric characteristics
Table 2 Visual acuity and refraction preoperatively and 1 week, 1 month and 3 months after surgery
Table 3 The correlation analysis between preoperative variables and postoperative spherical equivalent at 3 months
Figure 1 The adjusted quadratic curve for preoperative anterior chamber depth (ACD) and the spherical equivalent (SE). The x-axis represents SE and y-axis preoperative ACD. For ACD 2.8–4.12 mm, the postoperative SE was easy to shift to myopia, while for ACD <2.8 or >4.12 mm, the postoperative SE was prone to hyperopia.
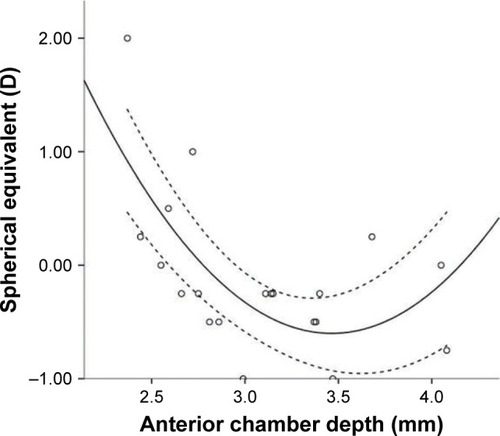
Table 4 Defocus curve and visual acuity at different deviations
Table 5 Contrast sensitivity of different spatial frequencies under photopic, mesopic, photopic with glare and mesopic with glare preoperatively and 1 week, 1 month and 3 months postoperatively
Table 6 Results of satisfaction questionnaire