Figures & data
Table 1 Contralateral comparison of basic parameters between keratoconus eyes with and without Vogt’s striae
Table 2 Contralateral comparison of biometric characteristics between keratoconus eyes with and without Vogt’s striae
Table 3 Contralateral comparison of tomographic characteristics between keratoconus eyes with and without Vogt’s striae
Table 4 Correlation coefficients of refractive, tomographic, and biometric characteristics of keratoconus eyes with and without Vogt’s striae
Table 5 Pentacam and ultrasound biometer measurements for anterior chamber depth of keratoconus eyes with and without Vogt’s striae
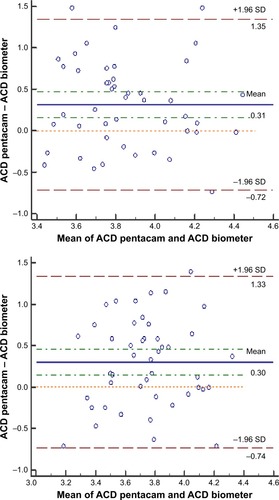
Figure 1 Bland–Altman plots of the ACD measured by the Pentacam against ultrasound biometer in KCN eyes with Vogt’s striae (top) and without Vogt’s striae (bottom). The middle line in each figure is the mean difference of the values and the lines on the sides represent the upper and lower 95% LoA (mean difference ±1.96 SD).