Figures & data
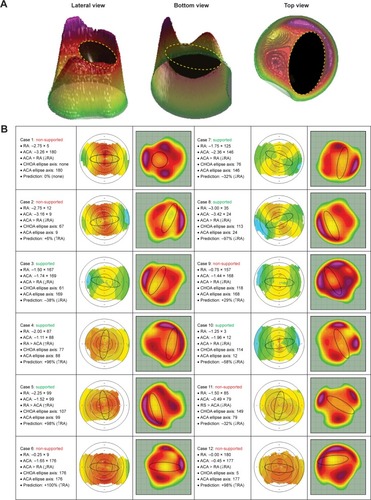
Figure 1 Difference between RA and ACA magnitude (ie, RA magnitude – ACA magnitude) in relation to the ACA axis and quadratic fitting of this relationship (red curve). Data points (blue dots) above the black dashed line indicate eyes where the ACA is smaller than the RA magnitude, and below show eyes where the ACA is greater. Blue-shaded area: WTR-ACA eyes; red-shaded area: ATR-ACA eyes.
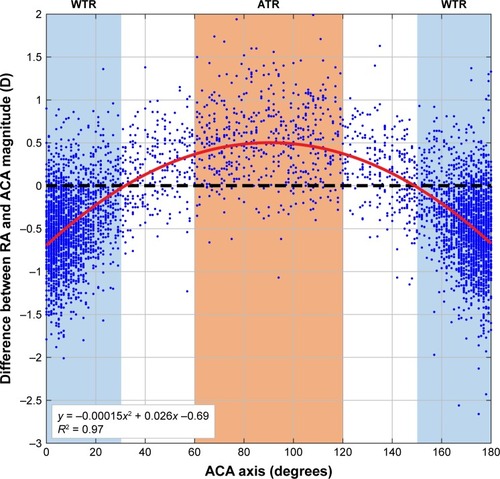
Figure 2 (A) Objective algorithm-based identification of a 3D ellipsoid in a representative Contoura CHOA ablation profile visualized at different angles. The CHOAs’ ellipse axis was calculated using the top view. (B) Case series of 12 eyes used to test Motwani’s claim. Left column, eye parameters; middle column, topographical corneal astigmatism where the ovalization is indicated by a black ellipse; right column, CHOAs’ profile where the ovalization is indicated by a black ellipse as in Motwani’s work.Citation2 Vectorial analyses were used to predict the effect of the interacting ellipses on RA as a positive or negative percentage change, setting both ellipses at equal magnitude. “Supported” and “Non-Supported” identify cases where Motwani’s claim is validated or not, respectively.