Figures & data
Figure 1 Average subscale scores for glaucoma patients on a Japanese version of the 25-item National Eye Institute Visual Function Questionnaire.
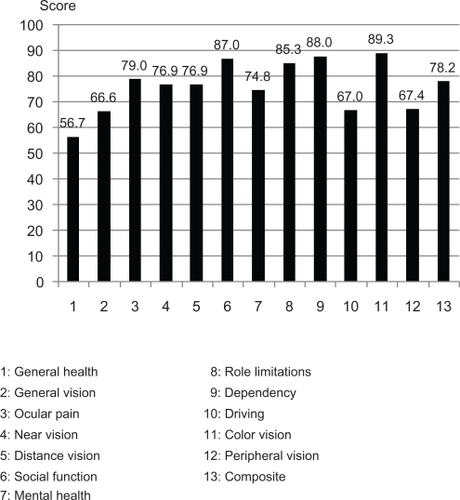
Table 1 Ophthalmological data for the glaucoma patients
Figure 2 Composite 25-item National Eye Institute Visual Function Questionnaire scores in the better eye (y-axis) are correlated with mean deviation scores from Humphrey Field Analyzer program 30-2 (x-axis).
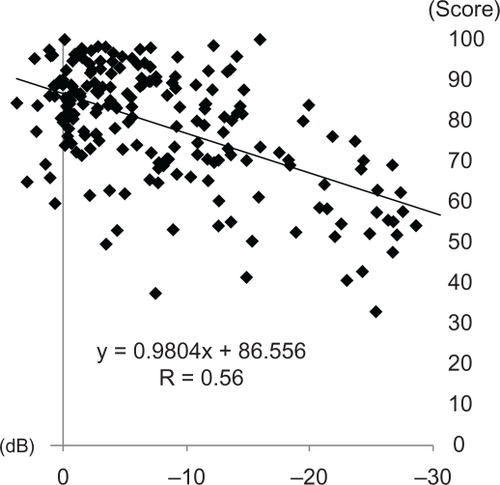
Figure 3 Composite 25-item National Eye Institute Visual Function Questionnaire scores in the worse eye (y-axis) are correlated with mean deviation scores from Humphrey Field Analyzer program 30-2 (x-axis).
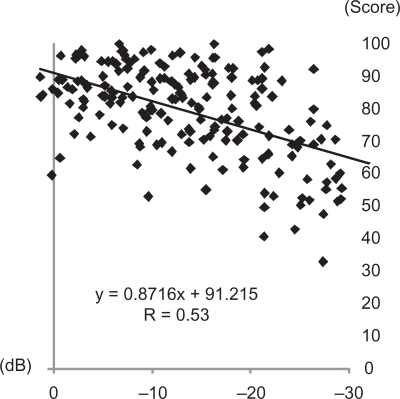
Table 2 P values and correlation coefficients for single linear regression analysis of the association between visual function and visual disability indices in the better eye
Table 3 P values and correlation coefficients for single linear regression analysis of visual function and visual disability indices in the worse eye
Figure 4 Average subscale scores for young and old glaucoma patients.
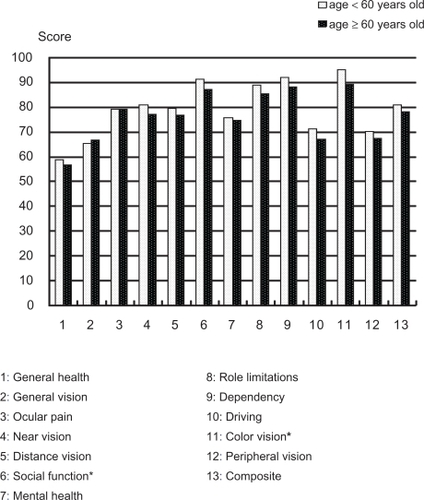
Table 4 Visual function data in young and old glaucoma patients
Table 5 MD threshold scores from HFA program 30-2 of which the number of the patients becomes significantly higher to have lower subscale scores. The definition of the lower subscale score was determined as lower than 59