Figures & data
Table 1 Baseline characteristics
Figure 1 The mean BCVA and the mean change from the baseline BCVA over time to month 6. (A) The mean BCVA improved significantly 1 month after an IVR injection, and the improvement continued through month 6. (B) The mean change from the baseline BCVA. The ETDRS gain from baseline significantly and gradually increased over time through month 6. Error bars represent SDs. *P<0.05 vs baseline, **P<0.01 vs baseline.
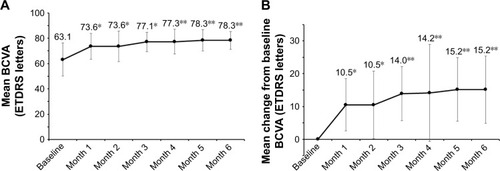
Table 2 Change from baseline best-corrected visual acuity at month 6
Table 3 Factors associated with best-corrected visual acuity (ETDRS letters) at month 6
Figure 2 The mean CRT and the mean change from the baseline CRT over time to month 6. (A) The mean CRT decreased significantly and rapidly 1 month after intravitreal injection of ranibizumab and continued to do so through month 6. (B) The CRT reduction at month 1 from baseline was significant, and the reduction continued through month 6. Error bars represent SDs. **P<0.01 vs baseline.
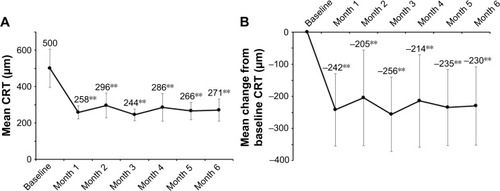
Table 4 Residual macular edema, microaneurysm, and total number of injections at month 6
Table 5 Factors associated with residual macular edema at month 6
Table 6 Factors associated with microaneurysms formation at month 6
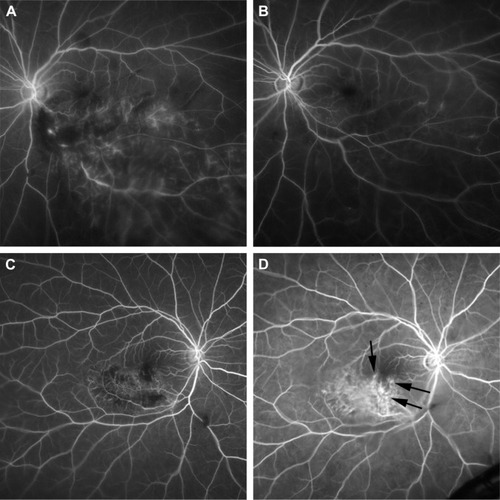
Figure 3 Microaneurysms detected by FA at month 6. (A and B) An early-phase FA image from a 62-year-old woman with BRVO. The patient received an initial IVR injection 1 month after disease onset. (A) A baseline FA image. (B) An FA image at month 6. No microaneurysms are seen. (C and D) Early-phase FA images from a 71-year-old woman with BRVO. The patient received an initial IVR injection 4 months after disease onset. (C) A baseline FA image. (D) An FA image obtained at month 6. Leaky microaneurysms (black arrows) are observed.