Figures & data
Table 1 Preoperative patient demographics and pIOL characteristics
Figure 1 Example of a lens implanted in one of the patients.
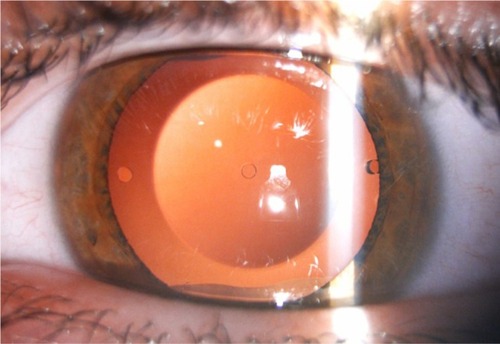
Figure 2 Plot of achieved vs attempted correction (predictability) for spherical equivalent (M) at 12, 24, and 36 months of follow-up.
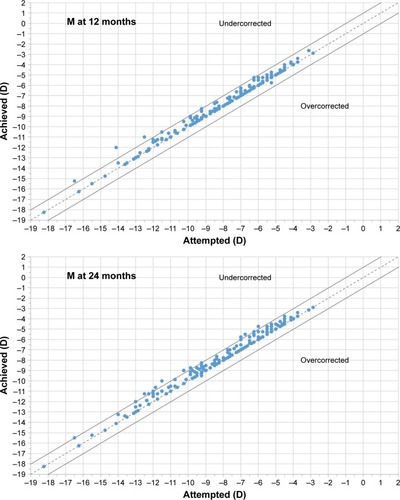
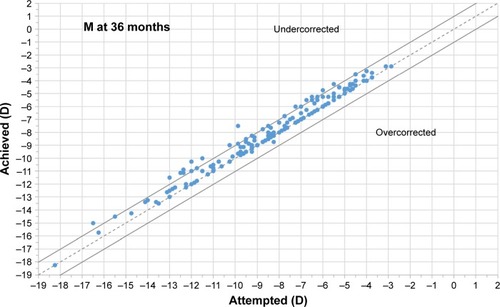
Figure 3 Preoperative and 12, 24, and 36 months postoperative astigmatic components of the power vector represented by the two-dimensional vector (J0, J45) (J0=Jackson cross-cylinder, axes at 180° and 90°; J45=Jackson cross-cylinder, axes at 45° and 135°).
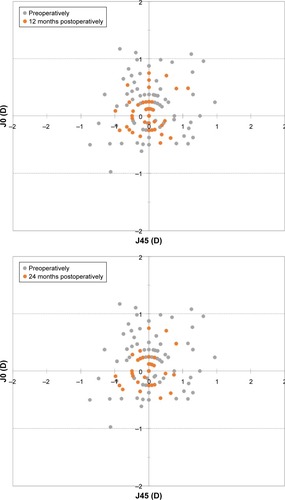
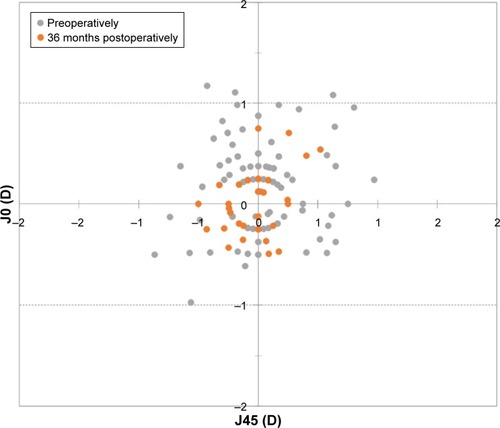
Figure 4 Improvement in refractive error and refraction stability for M, J0, and J45 during the 3 years of follow-up. Error bars represent the SD.
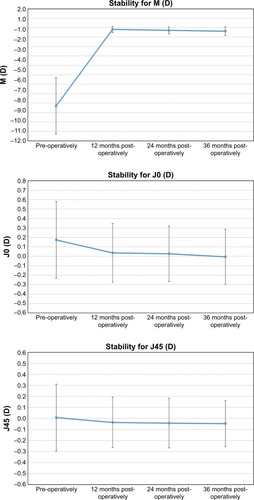
Figure 5 Postoperative changes in CDVA at 12, 24, and 36 months follow-up.
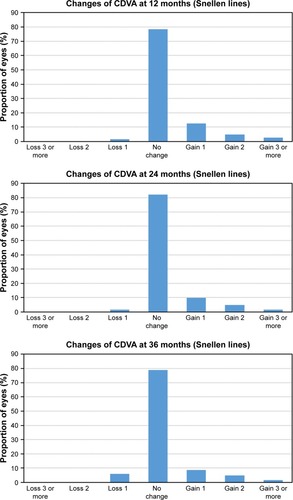
Figure 6 Cumulative proportion of eyes having a given UDVA value at 12, 24, and 36 months postoperatively. Preoperatively, all eyes had an UDVA worse than 20/63.
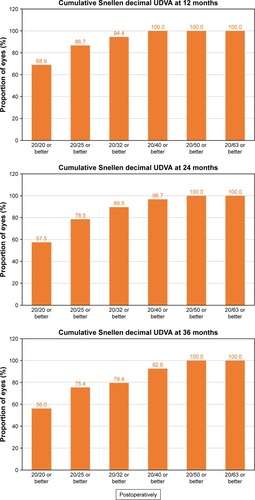
Figure 7 Cumulative proportion of eyes having a given CDVA value, both preoperatively and at 12, 24, and 36 months postoperatively.
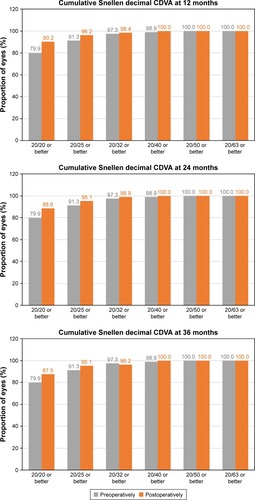
Figure 8 Evolution of the mean IOP (intraocular pressure), in mmHg for the whole follow-up period. Error bars represent the SD.
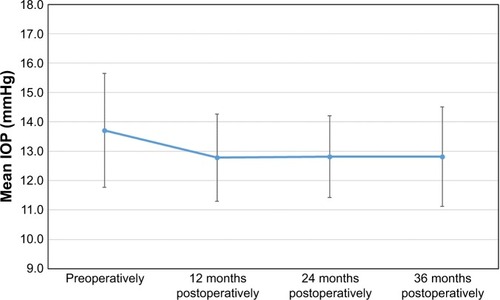
Figure 9 Evolution of the mean ECC, measured in cells/mm2, for the whole follow-up period. Error bars represent the SD.
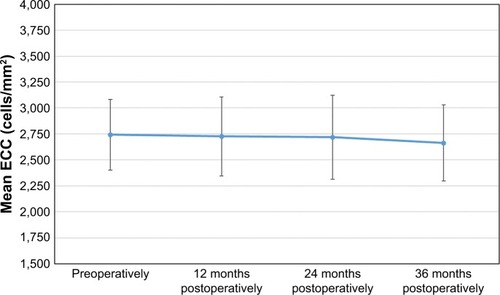
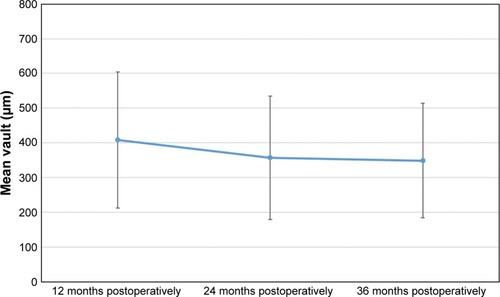
Figure 10 Evolution of the mean vault values, measured in µm, for the whole post-surgery follow-up period.